US Airways 2004 Annual Report Download - page 46
Download and view the complete annual report
Please find page 46 of the 2004 US Airways annual report below. You can navigate through the pages in the report by either clicking on the pages listed below, or by using the keyword search tool below to find specific information within the annual report.-
 1
1 -
2
-
3
-
4
-
5
-
6
-
7
-
8
-
9
-
10
-
11
-
12
-
13
-
14
-
15
-
16
-
17
-
18
-
19
-
20
-
21
-
22
-
23
-
24
-
25
-
26
-
27
-
28
-
29
-
30
-
31
-
32
-
33
-
34
-
35
-
 36
36 -
 37
37 -
 38
38 -
 39
39 -
 40
40 -
 41
41 -
 42
42 -
 43
43 -
 44
44 -
 45
45 -
 46
46 -
 47
47 -
 48
48 -
 49
49 -
 50
50 -
 51
51 -
 52
52 -
 53
53 -
 54
54 -
 55
55 -
 56
56 -
57
-
58
-
59
-
60
-
61
-
62
-
63
-
64
-
65
-
66
-
67
-
68
-
69
-
70
-
71
-
72
-
73
-
74
-
75
-
76
-
77
-
78
-
79
-
80
-
81
-
82
-
83
-
84
-
85
-
86
-
87
-
88
-
89
-
90
-
91
-
92
-
93
-
94
-
95
-
96
-
97
-
98
-
99
-
100
-
101
-
102
-
103
-
104
-
105
-
106
-
107
-
108
-
109
-
110
-
111
-
112
-
113
-
114
-
115
-
116
-
117
-
118
-
119
-
120
-
121
-
122
-
123
-
124
-
125
-
126
-
127
-
128
-
129
-
130
-
131
-
132
-
133
-
134
-
135
-
136
-
137
-
138
-
139
-
140
-
141
-
142
-
143
-
144
-
145
-
146
-
147
-
148
-
149
-
150
-
151
-
152
-
153
-
154
-
155
-
156
-
157
-
158
-
159
-
160
-
161
-
162
-
163
-
164
-
165
-
166
-
167
-
168
-
169
-
170
-
171
-
172
-
173
-
174
-
175
-
176
-
177
-
178
-
179
-
180
-
181
-
182
-
183
-
184
-
185
-
186
-
187
-
188
-
189
-
190
-
191
-
192
-
193
-
194
-
195
-
196
-
197
-
198
-
199
-
200
-
201
-
202
-
203
-
204
-
205
-
206
-
207
-
208
-
209
-
210
-
211
-
212
-
213
-
214
-
215
-
216
-
217
-
218
-
219
-
220
-
221
-
222
-
223
-
224
-
225
-
226
-
227
-
228
-
229
-
230
-
231
-
232
-
233
-
234
-
235
-
236
-
237
-
238
-
239
-
240
-
241
-
242
-
243
-
244
-
245
-
246
-
247
-
248
-
249
-
250
-
251
-
252
-
253
-
254
-
255
-
256
-
257
-
258
-
259
-
260
-
261
-
262
-
263
-
264
-
265
-
266
-
267
-
268
-
269
-
270
-
271
-
272
-
273
-
274
-
275
-
276
-
277
-
278
-
279
-
280
-
281
-
282
-
283
-
284
-
285
-
286
-
287
-
288
-
289
-
290
-
291
-
292
-
293
-
294
-
295
-
296
-
297
-
298
-
299
-
300
-
301
-
302
-
303
-
304
-
305
-
306
-
307
-
308
-
309
-
310
-
311
-
312
-
313
-
314
-
315
-
316
-
317
-
318
-
319
-
320
-
321
-
322
-
323
-
324
-
325
-
326
-
327
-
328
-
329
-
330
-
331
-
332
-
333
-
334
-
335
-
336
-
337
-
338
-
339
-
340
-
341
-
342
-
343
-
344
-
345
-
346
 |
 |

Table of Contents
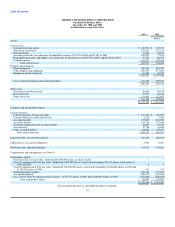
AMERICA WEST HOLDINGS CORPORATION
Consolidated Balance Sheets
December 31, 2004 and 2003
(in thousands except share data)
2004 2003
(as restated-See
Note 2)
Assets
Current assets:
Cash and cash equivalents $ 149,091 $ 153,357
Short-term investments 126,651 322,615
Restricted cash 41,264 42,900
Accounts receivable, less allowance for doubtful accounts of $1,487 in 2004 and $5,807 in 2003 108,837 77,235
Expendable spare parts and supplies, less allowance for obsolescence of $14,759 in 2004 and $12,254 in 2003 57,563 58,575
Prepaid expenses 141,571 129,368
Total current assets 624,977 784,050
Property and equipment:
Flight equipment 926,930 858,395
Other property and equipment 290,897 273,284
Equipment purchase deposits 63,450 46,050
1,281,277 1,177,729
Less accumulated depreciation and amortization 624,742 570,017
656,535 607,712
Other assets:
Investments in debt securities 30,000 40,740
Restricted cash 72,091 69,876
Other assets, net 91,661 112,007
193,752 222,623
$1,475,264 $ 1,614,385
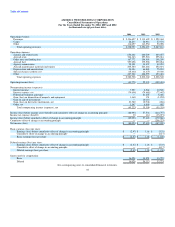
Liabilities and Stockholders' Equity
Current liabilities:
Current maturities of long-term debt $ 151,183 $ 103,899
Current obligations under capital leases 3,475 3,442
Accounts payable 173,887 210,288
Air traffic liability 194,718 174,486
Accrued compensation and vacation benefits 42,699 61,045
Accrued taxes 32,796 36,846
Other accrued liabilities 65,958 59,277
Total current liabilities 664,716 649,283
Long-term debt, less current maturities 635,129 688,965
Capital leases, less current obligations 5,061 8,467
Deferred credits and other liabilities 133,911 141,681
Commitments and contingencies (see Note 6)
Stockholders' equity:
Preferred stock, $.01 par value. Authorized 48,800,000 shares; no shares issued — —
Class A common stock, $.01 par value. Authorized 1,200,000 shares; issued and outstanding 859,117 shares at December 31,
2004 and 2003 8 8
Class B common stock, $.01 par value. Authorized 100,000,000 shares; issued and outstanding 51,564,865 shares in 2004 and
51,239,200 shares in 2003 516 512
Additional paid-in capital 632,446 631,269
Accumulated deficit (288,617) (199,594)
Less: Cost of Class B common stock in treasury, 16,437,575 shares in 2004 and 16,283,895 shares in 2003 (307,906) (306,206)
Total stockholders' equity 36,447 125,989
$1,475,264 $ 1,614,385
See accompanying notes to consolidated financial statements.
43