US Airways 2004 Annual Report Download - page 26
Download and view the complete annual report
Please find page 26 of the 2004 US Airways annual report below. You can navigate through the pages in the report by either clicking on the pages listed below, or by using the keyword search tool below to find specific information within the annual report.-
 1
1 -
2
-
3
-
4
-
5
-
6
-
7
-
8
-
9
-
10
-
11
-
12
-
13
-
14
-
15
-
 16
16 -
 17
17 -
 18
18 -
 19
19 -
 20
20 -
 21
21 -
 22
22 -
 23
23 -
 24
24 -
 25
25 -
 26
26 -
 27
27 -
 28
28 -
 29
29 -
 30
30 -
 31
31 -
 32
32 -
 33
33 -
 34
34 -
 35
35 -
 36
36 -
37
-
38
-
39
-
40
-
41
-
42
-
43
-
44
-
45
-
46
-
47
-
48
-
49
-
50
-
51
-
52
-
53
-
54
-
55
-
56
-
57
-
58
-
59
-
60
-
61
-
62
-
63
-
64
-
65
-
66
-
67
-
68
-
69
-
70
-
71
-
72
-
73
-
74
-
75
-
76
-
77
-
78
-
79
-
80
-
81
-
82
-
83
-
84
-
85
-
86
-
87
-
88
-
89
-
90
-
91
-
92
-
93
-
94
-
95
-
96
-
97
-
98
-
99
-
100
-
101
-
102
-
103
-
104
-
105
-
106
-
107
-
108
-
109
-
110
-
111
-
112
-
113
-
114
-
115
-
116
-
117
-
118
-
119
-
120
-
121
-
122
-
123
-
124
-
125
-
126
-
127
-
128
-
129
-
130
-
131
-
132
-
133
-
134
-
135
-
136
-
137
-
138
-
139
-
140
-
141
-
142
-
143
-
144
-
145
-
146
-
147
-
148
-
149
-
150
-
151
-
152
-
153
-
154
-
155
-
156
-
157
-
158
-
159
-
160
-
161
-
162
-
163
-
164
-
165
-
166
-
167
-
168
-
169
-
170
-
171
-
172
-
173
-
174
-
175
-
176
-
177
-
178
-
179
-
180
-
181
-
182
-
183
-
184
-
185
-
186
-
187
-
188
-
189
-
190
-
191
-
192
-
193
-
194
-
195
-
196
-
197
-
198
-
199
-
200
-
201
-
202
-
203
-
204
-
205
-
206
-
207
-
208
-
209
-
210
-
211
-
212
-
213
-
214
-
215
-
216
-
217
-
218
-
219
-
220
-
221
-
222
-
223
-
224
-
225
-
226
-
227
-
228
-
229
-
230
-
231
-
232
-
233
-
234
-
235
-
236
-
237
-
238
-
239
-
240
-
241
-
242
-
243
-
244
-
245
-
246
-
247
-
248
-
249
-
250
-
251
-
252
-
253
-
254
-
255
-
256
-
257
-
258
-
259
-
260
-
261
-
262
-
263
-
264
-
265
-
266
-
267
-
268
-
269
-
270
-
271
-
272
-
273
-
274
-
275
-
276
-
277
-
278
-
279
-
280
-
281
-
282
-
283
-
284
-
285
-
286
-
287
-
288
-
289
-
290
-
291
-
292
-
293
-
294
-
295
-
296
-
297
-
298
-
299
-
300
-
301
-
302
-
303
-
304
-
305
-
306
-
307
-
308
-
309
-
310
-
311
-
312
-
313
-
314
-
315
-
316
-
317
-
318
-
319
-
320
-
321
-
322
-
323
-
324
-
325
-
326
-
327
-
328
-
329
-
330
-
331
-
332
-
333
-
334
-
335
-
336
-
337
-
338
-
339
-
340
-
341
-
342
-
343
-
344
-
345
-
346
 |
 |

Table of Contents
• We increased point-to-point flying and utilization flying, (using an aircraft that would ordinarily be parked at a gate for additional flights at minimal
additional costs).
• We continued to aggressively manage yield during peak travel periods.
• We overhauled our first class fare structure much in the same way we did to our coach fares in 2002. This initiative reduced first class fares by up to
70 percent in some markets as compared to legacy carriers' first class fares.
• We launched two new websites designed to increase revenues from travel agents and corporate travel managers while lowering distribution costs.
We also continued to position our airline as a low cost carrier with unique elements that differentiate our service from other low cost carriers. For example,
in 2004 we continued, and intend to continue, to offer full service amenities that the major airlines offer, such as first class seating, an award winning frequent
flyer program, FlightFund, and assigned seating. We believe that leisure and business customers will continue to value the service of low cost carriers and that
our full service amenities give us a competitive advantage over other low cost carriers.
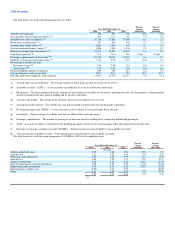
In spite of these initiatives and others designed to increase revenue and productivity and reduce costs, we reported a net loss of $89.0 million in 2004
compared to net income of $57.4 million in 2003. The change in earnings was driven by a $181.1 million increase in fuel expense primarily due to a 39.1%
increase in the average price per gallon of fuel. The 2003 results also included a nonoperating gain of $81.3 million related to federal government assistance
recognized under the Emergency Wartime Supplemental Appropriations Act.
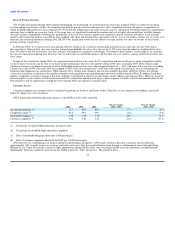
Capacity, as measured by available seat miles (ASMs), was up 8.1% as compared to 2003. Passenger revenues were up 3.9% to $2.2 billion for 2004 over
2003. Passenger revenue per available seat mile (RASM) fell 3.8% during 2004 to 7.29 cents versus 2003 primarily due to a 5.2% decline in yield, a 7.9%
increase in aircraft utilization and a 4.7% increase in average stage length.
Total operating expenses were $2.4 billion, an increase of 6.7% from 2003. The average fuel price per gallon increased 39.1% to $1.24 during 2004. This,
along with increased fuel burn due to increased flying during 2004, resulted in a 48.1% increase in fuel expenses in 2004 over 2003. In spite of the enormous
increase in the cost of fuel, stringent cost controls enabled us to decrease unit costs by 1.3% during 2004 to 7.89 cents.
In spite of our diligent work to contain our costs, we believe revenues will continue to reflect the excess capacity that exists across the domestic system and
fuel prices will remain at, or exceed, record highs. Given these conditions, we anticipate significant losses for full year 2005.
As of December 31, 2004, Holdings' unrestricted and restricted cash, cash equivalents, short-term investments and investments in debt securities totaled
$419.1 million. Although there can be no assurances, we believe that this cash balance, coupled with our financing commitments and cash flows from
operating activities during 2005, will be adequate to fund our operating and capital needs as well as enable us to remain compliant with our various debt
agreements through at least December 31, 2005.
Cost Control
We remain committed to maintaining a low cost structure, which we believe offers a significant competitive advantage over other major hub-and-spoke
airlines in the United States. In 2004, our operating cost per available seat mile, or CASM, of 7.89 cents was the lowest of all the other major hub-and-spoke
airlines in the United States and remained competitive with the major point-to-point airline, Southwest Airlines.
In light of the current industry environment, we continue to focus on minimizing capital expenditures and prudent spending for discretionary expenses.
23