US Airways 2004 Annual Report Download - page 31
Download and view the complete annual report
Please find page 31 of the 2004 US Airways annual report below. You can navigate through the pages in the report by either clicking on the pages listed below, or by using the keyword search tool below to find specific information within the annual report.-
 1
1 -
2
-
3
-
4
-
5
-
6
-
7
-
8
-
9
-
10
-
11
-
12
-
13
-
14
-
15
-
16
-
17
-
18
-
19
-
20
-
 21
21 -
 22
22 -
 23
23 -
 24
24 -
 25
25 -
 26
26 -
 27
27 -
 28
28 -
 29
29 -
 30
30 -
 31
31 -
 32
32 -
 33
33 -
 34
34 -
 35
35 -
 36
36 -
 37
37 -
 38
38 -
 39
39 -
 40
40 -
 41
41 -
42
-
43
-
44
-
45
-
46
-
47
-
48
-
49
-
50
-
51
-
52
-
53
-
54
-
55
-
56
-
57
-
58
-
59
-
60
-
61
-
62
-
63
-
64
-
65
-
66
-
67
-
68
-
69
-
70
-
71
-
72
-
73
-
74
-
75
-
76
-
77
-
78
-
79
-
80
-
81
-
82
-
83
-
84
-
85
-
86
-
87
-
88
-
89
-
90
-
91
-
92
-
93
-
94
-
95
-
96
-
97
-
98
-
99
-
100
-
101
-
102
-
103
-
104
-
105
-
106
-
107
-
108
-
109
-
110
-
111
-
112
-
113
-
114
-
115
-
116
-
117
-
118
-
119
-
120
-
121
-
122
-
123
-
124
-
125
-
126
-
127
-
128
-
129
-
130
-
131
-
132
-
133
-
134
-
135
-
136
-
137
-
138
-
139
-
140
-
141
-
142
-
143
-
144
-
145
-
146
-
147
-
148
-
149
-
150
-
151
-
152
-
153
-
154
-
155
-
156
-
157
-
158
-
159
-
160
-
161
-
162
-
163
-
164
-
165
-
166
-
167
-
168
-
169
-
170
-
171
-
172
-
173
-
174
-
175
-
176
-
177
-
178
-
179
-
180
-
181
-
182
-
183
-
184
-
185
-
186
-
187
-
188
-
189
-
190
-
191
-
192
-
193
-
194
-
195
-
196
-
197
-
198
-
199
-
200
-
201
-
202
-
203
-
204
-
205
-
206
-
207
-
208
-
209
-
210
-
211
-
212
-
213
-
214
-
215
-
216
-
217
-
218
-
219
-
220
-
221
-
222
-
223
-
224
-
225
-
226
-
227
-
228
-
229
-
230
-
231
-
232
-
233
-
234
-
235
-
236
-
237
-
238
-
239
-
240
-
241
-
242
-
243
-
244
-
245
-
246
-
247
-
248
-
249
-
250
-
251
-
252
-
253
-
254
-
255
-
256
-
257
-
258
-
259
-
260
-
261
-
262
-
263
-
264
-
265
-
266
-
267
-
268
-
269
-
270
-
271
-
272
-
273
-
274
-
275
-
276
-
277
-
278
-
279
-
280
-
281
-
282
-
283
-
284
-
285
-
286
-
287
-
288
-
289
-
290
-
291
-
292
-
293
-
294
-
295
-
296
-
297
-
298
-
299
-
300
-
301
-
302
-
303
-
304
-
305
-
306
-
307
-
308
-
309
-
310
-
311
-
312
-
313
-
314
-
315
-
316
-
317
-
318
-
319
-
320
-
321
-
322
-
323
-
324
-
325
-
326
-
327
-
328
-
329
-
330
-
331
-
332
-
333
-
334
-
335
-
336
-
337
-
338
-
339
-
340
-
341
-
342
-
343
-
344
-
345
-
346
 |
 |

Table of Contents
2004 Compared with 2003
AWA realized an operating loss of $39.7 million in 2004 compared to operating income of $26.1 million in 2003. Loss before income taxes was
$85.3 million in 2004 compared to income before income taxes of $61.4 million for the comparable 2003 period.
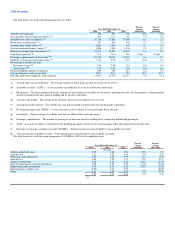
Total operating revenues for 2004 were $2.3 billion. Passenger revenues were $2.2 billion in 2004 compared to $2.1 billion in 2003. A 9.6% increase in
RPMs exceeded an 8.1% increase in capacity, as measured by ASMs, resulting in a 1.0 point increase in load factor to 77.4%. RASM during 2004 decreased
3.8 percent to 7.29 cents, despite a 4.7 percent increase in average stage length, while yields decreased 5.2 percent to 9.41 cents. Cargo revenues for 2004
increased $1.3 million (4.9%) due to higher mail volumes. Other revenues remained flat year of year.
Operating expenses increased $150.3 million or 6.7% compared to the comparable 2003 period, while ASMs increased 8.1% due to increases in average
stage length of 4.7% and aircraft utilization of 7.9%. CASM decreased 1.3% to 7.89 cents in 2004 from 7.99 cents in 2003 despite a 39.1% increase in
average fuel price per gallon. The 2004 period includes a $15.4 million reduction in special charges versus a $14.4 million charge in 2003. Significant
changes in the components of operating expense per ASM are explained as follows:
• Salaries and related costs per ASM decreased 7.9% due to increased productivity and lower benefit costs. ASMs increased 8.1% and average full-
time equivalent employees ("FTEs") decreased 2.2%. This increase in productivity was offset in part by a $26.5 million increase in pilot payroll
expense principally as a result of the new labor agreement with the Air Line Pilots Association ("ALPA") effective December 30, 2003.
• Aircraft rent expense per ASM decreased 5.4% due to the 7.9% increase in aircraft utilization.
• Other rents and landing fees expense per ASM remained flat year over year as increases in airport rents ($6.6 million) and landing fees
($5.7 million) were offset by the 8.1% increase in ASMs.
• Aircraft jet fuel expense per ASM increased 37.0% due primarily to a 39.1% increase in the average price per gallon of fuel to 123.7 cents in 2004
from 88.9 cents in 2003.
• Agency commissions expense per ASM decreased 32.4% due to the reductions in various travel agency incentive programs and lower override
commissions.
• Aircraft maintenance materials and repair expense per ASM decreased 14.8% due to decreases in capitalized maintenance amortization expense
($23.4 million), and aircraft C-Check expense ($4.0 million). The decrease in capitalized maintenance amortization expense is driven by changes in
the estimated useful life on certain engines, effective January 1, 2004, as a result of changes in aircraft utilization ($9.2 million), and on certain
aircraft engine overhaul costs, effective April 1, 2003, driven by a new maintenance agreement that guarantees minimum cycles on engine overhauls
($2.3 million). During 2004, the net decrease of fully amortized assets versus new asset amortization totaled $6.6 million. These decreases were
partially offset by increases in airframe maintenance ($6.1 million) and engine overhaul ($3.7 million) expenses.
• Depreciation and amortization expense per ASM decreased 24.8% due to lower computer hardware and software amortization ($6.1 million) as a
result of AWA's cash conservation program, which reduced capital expenditures and lower amortization expenses related to aircraft leasehold
improvements ($1.7 million). The change in the estimated useful life as a result of changes in AWA's fleet plan discussed above contributed to the
decrease in depreciation for improvements on AWA's owned aircraft ($3.1 million), and for rotable and repairable spare parts ($2.1 million).
28