US Airways 2004 Annual Report Download - page 69
Download and view the complete annual report
Please find page 69 of the 2004 US Airways annual report below. You can navigate through the pages in the report by either clicking on the pages listed below, or by using the keyword search tool below to find specific information within the annual report.-
 1
1 -
2
-
3
-
4
-
5
-
6
-
7
-
8
-
9
-
10
-
11
-
12
-
13
-
14
-
15
-
16
-
17
-
18
-
19
-
20
-
21
-
22
-
23
-
24
-
25
-
26
-
27
-
28
-
29
-
30
-
31
-
32
-
33
-
34
-
35
-
36
-
37
-
38
-
39
-
40
-
41
-
42
-
43
-
44
-
45
-
46
-
47
-
48
-
49
-
50
-
51
-
52
-
53
-
54
-
55
-
56
-
57
-
58
-
 59
59 -
 60
60 -
 61
61 -
 62
62 -
 63
63 -
 64
64 -
 65
65 -
 66
66 -
 67
67 -
 68
68 -
 69
69 -
 70
70 -
 71
71 -
 72
72 -
 73
73 -
 74
74 -
 75
75 -
 76
76 -
 77
77 -
 78
78 -
 79
79 -
80
-
81
-
82
-
83
-
84
-
85
-
86
-
87
-
88
-
89
-
90
-
91
-
92
-
93
-
94
-
95
-
96
-
97
-
98
-
99
-
100
-
101
-
102
-
103
-
104
-
105
-
106
-
107
-
108
-
109
-
110
-
111
-
112
-
113
-
114
-
115
-
116
-
117
-
118
-
119
-
120
-
121
-
122
-
123
-
124
-
125
-
126
-
127
-
128
-
129
-
130
-
131
-
132
-
133
-
134
-
135
-
136
-
137
-
138
-
139
-
140
-
141
-
142
-
143
-
144
-
145
-
146
-
147
-
148
-
149
-
150
-
151
-
152
-
153
-
154
-
155
-
156
-
157
-
158
-
159
-
160
-
161
-
162
-
163
-
164
-
165
-
166
-
167
-
168
-
169
-
170
-
171
-
172
-
173
-
174
-
175
-
176
-
177
-
178
-
179
-
180
-
181
-
182
-
183
-
184
-
185
-
186
-
187
-
188
-
189
-
190
-
191
-
192
-
193
-
194
-
195
-
196
-
197
-
198
-
199
-
200
-
201
-
202
-
203
-
204
-
205
-
206
-
207
-
208
-
209
-
210
-
211
-
212
-
213
-
214
-
215
-
216
-
217
-
218
-
219
-
220
-
221
-
222
-
223
-
224
-
225
-
226
-
227
-
228
-
229
-
230
-
231
-
232
-
233
-
234
-
235
-
236
-
237
-
238
-
239
-
240
-
241
-
242
-
243
-
244
-
245
-
246
-
247
-
248
-
249
-
250
-
251
-
252
-
253
-
254
-
255
-
256
-
257
-
258
-
259
-
260
-
261
-
262
-
263
-
264
-
265
-
266
-
267
-
268
-
269
-
270
-
271
-
272
-
273
-
274
-
275
-
276
-
277
-
278
-
279
-
280
-
281
-
282
-
283
-
284
-
285
-
286
-
287
-
288
-
289
-
290
-
291
-
292
-
293
-
294
-
295
-
296
-
297
-
298
-
299
-
300
-
301
-
302
-
303
-
304
-
305
-
306
-
307
-
308
-
309
-
310
-
311
-
312
-
313
-
314
-
315
-
316
-
317
-
318
-
319
-
320
-
321
-
322
-
323
-
324
-
325
-
326
-
327
-
328
-
329
-
330
-
331
-
332
-
333
-
334
-
335
-
336
-
337
-
338
-
339
-
340
-
341
-
342
-
343
-
344
-
345
-
346
 |
 |

Table of Contents
AMERICA WEST HOLDINGS CORPORATION
NOTES TO CONSOLIDATED FINANCIAL STATEMENTS — CONTINUED
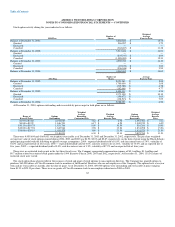
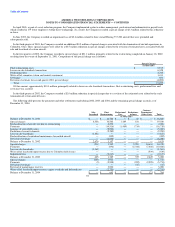
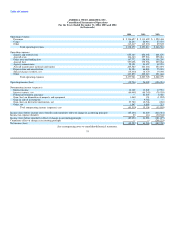
13. Earnings (Loss) Per Share
Year Ended December 31,
2004 2003 2002
(in thousands of dollars except per share data)
BASIC EARNINGS (LOSS) PER SHARE
Income (loss) before cumulative effect of change in accounting principle $ (89,023) $ 57,420 $ (179,686)
Cumulative effect of change in accounting principle — — (208,223)
Net income (loss) $ (89,023) $ 57,420 $ (387,909)
Weighted average common shares outstanding 36,026,478 34,550,979 33,723,252
Basic earnings (loss) per share:
Earnings (loss) before cumulative effect of change in accounting principle $ (2.47) $ 1.66 $ (5.33)
Cumulative effect of change in accounting principle — — (6.17)
Net earnings (loss) $ (2.47) $ 1.66 $ (11.50)
DILUTED EARNINGS (LOSS) PER SHARE
Income (loss) before cumulative effect of change in accounting principle $ (89,023) $ 57,420 $ (179,686)
Cumulative effect of change in accounting principle — — (208,223)
Net income (loss) (89,023) 57,420 (387,909)
Interest expense on 7.5% convertible senior notes — 10,664 —
Interest expense on 7.25% senior exchangeable notes — 2,881 —
Income (loss) for purposes of computing diluted net income (loss) per share $ (89,023) $ 70,965 $ (387,909)
Share computation:
Weighted average common shares outstanding 36,026,478 34,550,979 33,723,252
Assumed exercise of stock options and warrants — 9,966,128 —
Assumed conversion of 7.5% convertible senior notes — 8,157,839 —
Assumed conversion of 7.25% senior exchangeable notes — 3,437,960 —
Weighted average common shares outstanding as adjusted 36,026,478 56,112,906 33,723,252
Diluted earnings (loss) per share:
Earnings (loss) before cumulative effect of change in accounting principle $ (2.47) $ 1.26 $ (5.33)
Cumulative effect of change in accounting principle — — (6.17)
Net earnings (loss) $ (2.47) $ 1.26 $ (11.50)
For the year ended December 31, 2004, 5,248,891 stock options and 7,352,988 warrants issued in conjunction with the government guaranteed loan and
related transactions are not included in the computation of diluted EPS because the option and warrant exercise prices were greater than the average market
price of common stock for the period. In addition, 8,095,842 shares issuable upon conversion of the 7.25% senior exchangeable notes due 2023 and 8,694,000
issuable upon conversion of the 7.5% convertible senior notes are not included in the computation of diluted EPS because of the antidilutive effect on EPS.
For the year ended December 31, 2003, 5,256,111 stock options and 11,410,318 warrants issued in conjunction with the government guaranteed loan and
related transactions are not included in the computation of diluted EPS because the option and warrant exercise prices were greater than the average market
price of common stock for the period. In November 2004, the Emerging Issues Task Force ("EITF") of the FASB reached a consensus on EITF 04-08, "The
Effect of Contingently Convertible Instruments on Diluted Earnings per Share," which requires that issuers of convertible securities with contingent
conversion features use the "if-converted" method to calculate reported earnings per share ("EPS") irrespective of the contingent conversion trigger being met.
As approved by the FASB, this change is effective for years ending after December 15, 2004. The Company applied this methodology in the accompanying
consolidated statement of operations. The impact of using the "if-converted" method for the Company's 7.25% Notes is antidilutive for the years ended
December 31, 2004 and 2002. For the year ended December 31, 2003, the inclusion of the 7.25% Notes reduced diluted EPS by $0.03 from $1.29 to $1.26.
66