US Airways 2004 Annual Report Download - page 25
Download and view the complete annual report
Please find page 25 of the 2004 US Airways annual report below. You can navigate through the pages in the report by either clicking on the pages listed below, or by using the keyword search tool below to find specific information within the annual report.-
 1
1 -
2
-
3
-
4
-
5
-
6
-
7
-
8
-
9
-
10
-
11
-
12
-
13
-
14
-
 15
15 -
 16
16 -
 17
17 -
 18
18 -
 19
19 -
 20
20 -
 21
21 -
 22
22 -
 23
23 -
 24
24 -
 25
25 -
 26
26 -
 27
27 -
 28
28 -
 29
29 -
 30
30 -
 31
31 -
 32
32 -
 33
33 -
 34
34 -
 35
35 -
36
-
37
-
38
-
39
-
40
-
41
-
42
-
43
-
44
-
45
-
46
-
47
-
48
-
49
-
50
-
51
-
52
-
53
-
54
-
55
-
56
-
57
-
58
-
59
-
60
-
61
-
62
-
63
-
64
-
65
-
66
-
67
-
68
-
69
-
70
-
71
-
72
-
73
-
74
-
75
-
76
-
77
-
78
-
79
-
80
-
81
-
82
-
83
-
84
-
85
-
86
-
87
-
88
-
89
-
90
-
91
-
92
-
93
-
94
-
95
-
96
-
97
-
98
-
99
-
100
-
101
-
102
-
103
-
104
-
105
-
106
-
107
-
108
-
109
-
110
-
111
-
112
-
113
-
114
-
115
-
116
-
117
-
118
-
119
-
120
-
121
-
122
-
123
-
124
-
125
-
126
-
127
-
128
-
129
-
130
-
131
-
132
-
133
-
134
-
135
-
136
-
137
-
138
-
139
-
140
-
141
-
142
-
143
-
144
-
145
-
146
-
147
-
148
-
149
-
150
-
151
-
152
-
153
-
154
-
155
-
156
-
157
-
158
-
159
-
160
-
161
-
162
-
163
-
164
-
165
-
166
-
167
-
168
-
169
-
170
-
171
-
172
-
173
-
174
-
175
-
176
-
177
-
178
-
179
-
180
-
181
-
182
-
183
-
184
-
185
-
186
-
187
-
188
-
189
-
190
-
191
-
192
-
193
-
194
-
195
-
196
-
197
-
198
-
199
-
200
-
201
-
202
-
203
-
204
-
205
-
206
-
207
-
208
-
209
-
210
-
211
-
212
-
213
-
214
-
215
-
216
-
217
-
218
-
219
-
220
-
221
-
222
-
223
-
224
-
225
-
226
-
227
-
228
-
229
-
230
-
231
-
232
-
233
-
234
-
235
-
236
-
237
-
238
-
239
-
240
-
241
-
242
-
243
-
244
-
245
-
246
-
247
-
248
-
249
-
250
-
251
-
252
-
253
-
254
-
255
-
256
-
257
-
258
-
259
-
260
-
261
-
262
-
263
-
264
-
265
-
266
-
267
-
268
-
269
-
270
-
271
-
272
-
273
-
274
-
275
-
276
-
277
-
278
-
279
-
280
-
281
-
282
-
283
-
284
-
285
-
286
-
287
-
288
-
289
-
290
-
291
-
292
-
293
-
294
-
295
-
296
-
297
-
298
-
299
-
300
-
301
-
302
-
303
-
304
-
305
-
306
-
307
-
308
-
309
-
310
-
311
-
312
-
313
-
314
-
315
-
316
-
317
-
318
-
319
-
320
-
321
-
322
-
323
-
324
-
325
-
326
-
327
-
328
-
329
-
330
-
331
-
332
-
333
-
334
-
335
-
336
-
337
-
338
-
339
-
340
-
341
-
342
-
343
-
344
-
345
-
346
 |
 |

Table of Contents
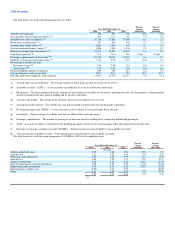
(c) Nonoperating income (expense) in the 2004 period includes a $30.5 million net gain on derivative instruments, which included mark-to-market changes
and settled transactions, and $1.3 million for the write-off of debt issue costs in connection with the refinancing of the term loan. The 2003 period
includes federal government assistance of $81.3 million recognized as nonoperating income under the Emergency Wartime Supplemental
Appropriations Act and $8.5 million and $108.2 million recognized in 2002 and 2001, respectively, as nonoperating income under the Air
Transportation Safety and System Stabilization Act. The 2003, 2002 and 2001 periods include a $10.7 million net gain, $0.7 million net loss and
$7.2 million net loss on derivative instruments, respectively, including mark-to-market changes and settled transactions. See Note 12, "Nonoperating
Income (Expenses) — Other, Net" in Holdings' Notes to Consolidated Financial Statements.
(d) The Company recalculated its diluted EPS for the year ended December 31, 2003 to include the 7.25% notes under the "if-converted" methodology.
The impact reduced diluted EPS by $0.03 from $1.29 to $1.26.
ITEM 7. MANAGEMENT'S DISCUSSION AND ANALYSIS OF FINANCIAL CONDITION AND RESULTS OF OPERATIONS
Holdings' primary business activity is ownership of the capital stock of AWA and, prior to January 1, 2004, The Leisure Company. Management's
Discussion and Analysis of Financial Condition and Results of Operations presented below relates to the consolidated financial statements of Holdings
presented in Item 8A and the consolidated financial statements for AWA presented in Item 8B.
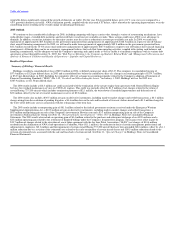
Restatement of Previously Reported Amounts
Derivative Instruments
In February 2005, management undertook a review of AWA's accounting for its fuel hedging transactions. As a result of this review, management
concluded that AWA's fuel hedging transactions did not qualify for hedge accounting under U.S. generally accepted accounting principles and that the
Company's financial statements for prior periods required restatement to reflect the fair value of fuel hedging contracts in the balance sheets and statements of
stockholders equity and comprehensive income of Holdings and AWA. See Note 2, "Restatement of Previously Reported Amounts" and Note 16, "Quarterly
Financial Data (Unaudited)" in Holdings' and Note 2, "Restatement of Previously Reported Amounts" and Note 15, "Quarterly Financial Data (Unaudited)"
in AWA's consolidated financial statements for the financial impact of the restatements. The Company concluded that these accounting errors were the result
of deficiencies in its internal control over financial reporting, from the lack of effective reviews of hedge transaction documentation and of quarterly mark-to-
market accounting entries on open fuel hedging contracts by personnel at an appropriate level.
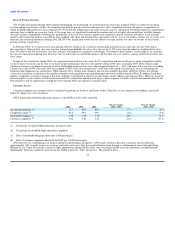
2004 in Review
Overview
Over the past several years, the U.S. domestic airline industry has experienced an unprecedented financial crisis caused by the combination of the terrorist
attacks of September 11, 2001, soft economic conditions, increased competition and capacity and high fuel prices. In response to these conditions, AWA had
repositioned itself as a low cost carrier and was able to operate profitably for 2003. During 2004, however, extremely high jet fuel prices and excessive
capacity throughout the domestic air system began to negatively impact all airlines including the low cost segment of the airline industry as well and several
low cost carriers that had previously operated profitably, including AWA, experienced declining earnings. Despite difficult industry conditions, AWA was
able to complete two financial transactions in the third and fourth quarters of 2004 that brought additional capital into the company and extended debt
maturities.
During 2004, our constant commitment to lower costs remained a priority and we implemented the following revenue and cost reduction initiatives:
22