US Airways 2004 Annual Report Download - page 24
Download and view the complete annual report
Please find page 24 of the 2004 US Airways annual report below. You can navigate through the pages in the report by either clicking on the pages listed below, or by using the keyword search tool below to find specific information within the annual report.-
 1
1 -
2
-
3
-
4
-
5
-
6
-
7
-
8
-
9
-
10
-
11
-
12
-
13
-
 14
14 -
 15
15 -
 16
16 -
 17
17 -
 18
18 -
 19
19 -
 20
20 -
 21
21 -
 22
22 -
 23
23 -
 24
24 -
 25
25 -
 26
26 -
 27
27 -
 28
28 -
 29
29 -
 30
30 -
 31
31 -
 32
32 -
 33
33 -
 34
34 -
35
-
36
-
37
-
38
-
39
-
40
-
41
-
42
-
43
-
44
-
45
-
46
-
47
-
48
-
49
-
50
-
51
-
52
-
53
-
54
-
55
-
56
-
57
-
58
-
59
-
60
-
61
-
62
-
63
-
64
-
65
-
66
-
67
-
68
-
69
-
70
-
71
-
72
-
73
-
74
-
75
-
76
-
77
-
78
-
79
-
80
-
81
-
82
-
83
-
84
-
85
-
86
-
87
-
88
-
89
-
90
-
91
-
92
-
93
-
94
-
95
-
96
-
97
-
98
-
99
-
100
-
101
-
102
-
103
-
104
-
105
-
106
-
107
-
108
-
109
-
110
-
111
-
112
-
113
-
114
-
115
-
116
-
117
-
118
-
119
-
120
-
121
-
122
-
123
-
124
-
125
-
126
-
127
-
128
-
129
-
130
-
131
-
132
-
133
-
134
-
135
-
136
-
137
-
138
-
139
-
140
-
141
-
142
-
143
-
144
-
145
-
146
-
147
-
148
-
149
-
150
-
151
-
152
-
153
-
154
-
155
-
156
-
157
-
158
-
159
-
160
-
161
-
162
-
163
-
164
-
165
-
166
-
167
-
168
-
169
-
170
-
171
-
172
-
173
-
174
-
175
-
176
-
177
-
178
-
179
-
180
-
181
-
182
-
183
-
184
-
185
-
186
-
187
-
188
-
189
-
190
-
191
-
192
-
193
-
194
-
195
-
196
-
197
-
198
-
199
-
200
-
201
-
202
-
203
-
204
-
205
-
206
-
207
-
208
-
209
-
210
-
211
-
212
-
213
-
214
-
215
-
216
-
217
-
218
-
219
-
220
-
221
-
222
-
223
-
224
-
225
-
226
-
227
-
228
-
229
-
230
-
231
-
232
-
233
-
234
-
235
-
236
-
237
-
238
-
239
-
240
-
241
-
242
-
243
-
244
-
245
-
246
-
247
-
248
-
249
-
250
-
251
-
252
-
253
-
254
-
255
-
256
-
257
-
258
-
259
-
260
-
261
-
262
-
263
-
264
-
265
-
266
-
267
-
268
-
269
-
270
-
271
-
272
-
273
-
274
-
275
-
276
-
277
-
278
-
279
-
280
-
281
-
282
-
283
-
284
-
285
-
286
-
287
-
288
-
289
-
290
-
291
-
292
-
293
-
294
-
295
-
296
-
297
-
298
-
299
-
300
-
301
-
302
-
303
-
304
-
305
-
306
-
307
-
308
-
309
-
310
-
311
-
312
-
313
-
314
-
315
-
316
-
317
-
318
-
319
-
320
-
321
-
322
-
323
-
324
-
325
-
326
-
327
-
328
-
329
-
330
-
331
-
332
-
333
-
334
-
335
-
336
-
337
-
338
-
339
-
340
-
341
-
342
-
343
-
344
-
345
-
346
 |
 |
Table of Contents
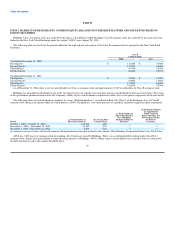
ITEM 6. SELECTED CONSOLIDATED FINANCIAL DATA
Selected Consolidated Financial Data of Holdings
The selected consolidated financial data presented below under the captions "Consolidated Statements of Operations Data" and "Consolidated Balance
Sheet Data" as of and for the years ended December 31, 2004, 2003, 2002, 2001 and 2000 are derived from the audited consolidated financial statements of
Holdings. The selected consolidated financial data should be read in conjunction with the consolidated financial statements for the respective periods, the
related notes and the related reports of the Company's independent registered public accounting firms.
Year ended December 31,
2004 2003 2002 2001 2000
(in thousands except per share amounts)
Consolidated statements of operations data:
Operating revenues $2,338,957 $2,254,497 $2,047,116 $2,065,913 $2,344,354
Operating expenses (b) 2,382,728 2,232,362 2,206,540 2,476,594 2,356,991
Operating income (loss) (43,771) 22,135 (159,424) (410,681) (12,637)
Income (loss) before income taxes (benefit) and cumulative effect of change in accounting
principle (c) (88,993) 57,534 (214,757) (324,387) 24,743
Income taxes (benefit) 30 114 (35,071) (74,536) 17,064
Income (loss) before cumulative effect of change in accounting principle (89,023) 57,420 (179,686) (249,851) 7,679
Net income (loss) (89,023) 57,420 (387,909) (249,851) 7,679
Earnings (loss) per share before cumulative effect of change in accounting principle:
Basic (2.47) 1.66 (5.33) (7.42) 0.22
Diluted (2.47) 1.26 (5.33) (7.42) 0.22
Net income (loss) per share:
Basic (2.47) 1.66 (11.50) (7.42) 0.22
Diluted (d) (2.47) 1.26 (11.50) (7.42) 0.22
Shares used for computation:
Basic 36,026 34,551 33,723 33,670 35,139
Diluted (d) 36,026 56,113 33,723 33,670 35,688
Consolidated balance sheet data (at end of period):
Total assets (a) $1,475,264 $1,614,385 $1,438,953 $1,469,218 $1,568,515
Long-term debt, less current maturities 635,129 688,965 700,983 224,551 145,578
Total stockholders' equity (a) 36,447 125,989 68,178 420,363 667,073
(a) The Company has restated its consolidated balance sheet and consolidated statement of stockholders' equity and comprehensive income as of and for
the year ended December 31, 2003 to reflect the non-compliance with SFAS No. 133. See Note 2, "Restatement of Previously Reported Amounts" in
Notes to Consolidated Financial Statements.
(b) The 2004 results include a $16.3 million net credit associated with the termination of the rate per engine hour agreement with General Electric Engine
Services for overhaul maintenance services on V2500-A1 engines, a $0.6 million credit related to the revision of the estimated costs associated with the
sale and leaseback of certain aircraft recorded in the first quarter of 2002 and a $0.4 million credit related to the revision of estimated charges associated
with the Columbus, Ohio hub ("CMH") closure originally recorded in the second quarter of 2003. These credits were partially offset by $1.9 million of
net charges related to the return of certain Boeing 737-200 aircraft which includes termination payments of $2.1 million, the write-down of leasehold
improvements and deferred rent of $2.8 million, offset by the net reversal of maintenance reserves of $3.0 million. The 2003 period includes
$16.0 million of charges resulting from the elimination of AWA's hub operations in CMH ($11.1 million), the reduction-in-force of certain
management, professional and administrative employees ($2.3 million), the impairment of certain owned Boeing 737-200 aircraft that have been
grounded ($2.6 million) offset by a $1.1 million reduction of charges due to a revision of the estimated costs related to the early termination of certain
aircraft leases and a $0.5 million reduction related to the revision of estimated costs associated with the sale and leaseback of certain aircraft. The 2002
period includes $19.0 million of charges primarily related to the restructuring completed on January 18, 2002, resulting from the events of
September 11, 2001. The 2001 period includes $141.6 million of special charges related to the impairment of reorganization value in excess of amounts
allocable to identifiable assets ("ERV") and owned aircraft and engines, as well as the earlier-than-planned return of seven leased aircraft and severance
expenses following a reduction-in-force in 2001. See Note 11, "Special Charges" in Holdings' Notes to Consolidated Financial Statements. The
Company reclassified amounts related to settled fuel hedge transactions and mark-to-market adjustments on open hedge instruments from fuel expense
to gain (loss) on derivative instruments, net. The amounts for the years ended December 31, 2004 and 2003 were an addition to fuel expense of
$30.5 million and $10.7 million, respectively. For the years ended December 31, 2002 and 2001, the amounts reduced fuel expense by $0.7 million and
$7.2 million, respectively. 21