US Airways 2004 Annual Report Download - page 27
Download and view the complete annual report
Please find page 27 of the 2004 US Airways annual report below. You can navigate through the pages in the report by either clicking on the pages listed below, or by using the keyword search tool below to find specific information within the annual report.-
 1
1 -
2
-
3
-
4
-
5
-
6
-
7
-
8
-
9
-
10
-
11
-
12
-
13
-
14
-
15
-
16
-
 17
17 -
 18
18 -
 19
19 -
 20
20 -
 21
21 -
 22
22 -
 23
23 -
 24
24 -
 25
25 -
 26
26 -
 27
27 -
 28
28 -
 29
29 -
 30
30 -
 31
31 -
 32
32 -
 33
33 -
 34
34 -
 35
35 -
 36
36 -
 37
37 -
38
-
39
-
40
-
41
-
42
-
43
-
44
-
45
-
46
-
47
-
48
-
49
-
50
-
51
-
52
-
53
-
54
-
55
-
56
-
57
-
58
-
59
-
60
-
61
-
62
-
63
-
64
-
65
-
66
-
67
-
68
-
69
-
70
-
71
-
72
-
73
-
74
-
75
-
76
-
77
-
78
-
79
-
80
-
81
-
82
-
83
-
84
-
85
-
86
-
87
-
88
-
89
-
90
-
91
-
92
-
93
-
94
-
95
-
96
-
97
-
98
-
99
-
100
-
101
-
102
-
103
-
104
-
105
-
106
-
107
-
108
-
109
-
110
-
111
-
112
-
113
-
114
-
115
-
116
-
117
-
118
-
119
-
120
-
121
-
122
-
123
-
124
-
125
-
126
-
127
-
128
-
129
-
130
-
131
-
132
-
133
-
134
-
135
-
136
-
137
-
138
-
139
-
140
-
141
-
142
-
143
-
144
-
145
-
146
-
147
-
148
-
149
-
150
-
151
-
152
-
153
-
154
-
155
-
156
-
157
-
158
-
159
-
160
-
161
-
162
-
163
-
164
-
165
-
166
-
167
-
168
-
169
-
170
-
171
-
172
-
173
-
174
-
175
-
176
-
177
-
178
-
179
-
180
-
181
-
182
-
183
-
184
-
185
-
186
-
187
-
188
-
189
-
190
-
191
-
192
-
193
-
194
-
195
-
196
-
197
-
198
-
199
-
200
-
201
-
202
-
203
-
204
-
205
-
206
-
207
-
208
-
209
-
210
-
211
-
212
-
213
-
214
-
215
-
216
-
217
-
218
-
219
-
220
-
221
-
222
-
223
-
224
-
225
-
226
-
227
-
228
-
229
-
230
-
231
-
232
-
233
-
234
-
235
-
236
-
237
-
238
-
239
-
240
-
241
-
242
-
243
-
244
-
245
-
246
-
247
-
248
-
249
-
250
-
251
-
252
-
253
-
254
-
255
-
256
-
257
-
258
-
259
-
260
-
261
-
262
-
263
-
264
-
265
-
266
-
267
-
268
-
269
-
270
-
271
-
272
-
273
-
274
-
275
-
276
-
277
-
278
-
279
-
280
-
281
-
282
-
283
-
284
-
285
-
286
-
287
-
288
-
289
-
290
-
291
-
292
-
293
-
294
-
295
-
296
-
297
-
298
-
299
-
300
-
301
-
302
-
303
-
304
-
305
-
306
-
307
-
308
-
309
-
310
-
311
-
312
-
313
-
314
-
315
-
316
-
317
-
318
-
319
-
320
-
321
-
322
-
323
-
324
-
325
-
326
-
327
-
328
-
329
-
330
-
331
-
332
-
333
-
334
-
335
-
336
-
337
-
338
-
339
-
340
-
341
-
342
-
343
-
344
-
345
-
346
 |
 |

Table of Contents
Revised Pricing Structure
The revenue environment during 2004 remained challenging. As background, we restructured our coach fares in March 2002 in an effort to maximize
revenue and increase business traffic. We eliminated our historic pricing structure and replaced it with a simplified structure, the primary components of
which included reduced business fares (typically 40-75% below the walkup prices on major network carriers), elimination of Saturday night stay requirements
and more fares available on a one-way basis. At the same time, we significantly reduced the number and level of highly discounted fares available through
off-tariff channels. Immediately following the introduction of the new fare structure, higher-cost competitors placed extremely low prices in our nonstop
markets and Continental Airlines cancelled its long-standing code share and frequent flyer agreements with us. As a result of these actions, our year-over-year
domestic unit revenue performance during 2002 and 2003 was significantly better than the industry average, and the net effect on revenue of our revised
pricing structure was positive.
In February 2004, we revised our first class pricing structure similar to the coach fare restructuring initiated on our coach fares in early 2002 and as
discussed above. The new first class fare structure featured nonrefundable first class fares that are up to 70% lower than the industry's traditional first class
fares. We believe that the revised first class fare structure will exploit our competitive advantages over both the major airlines, as their higher cost structures
may prevent them from reducing their first class fares to match ours in a profitable manner, and the other low cost carriers, as many of them do not have first
class cabins.
In spite of these initiatives, during 2004, we experienced increased low cost carrier (LCC) competition and increased legacy carrier competition, and the
results of these two factors can be seen in our unit revenue performance relative to the industry during 2004. Also, in January 2005, Delta Airlines made
significant changes to its domestic pricing structure. Refundable business fares were reduced approximately 50 — 60% with none of the new fares exceeding
a coach class cap of $499. First class fares were capped at $599. Delta also relaxed many of the rules with regard to leisure fares such as eliminating the
Saturday night minimum stay requirement. While America West still has lower business fares in most markets than those of Delta's, Delta's new pricing
scheme has resulted in a reduction in the number of markets and magnitude of pricing advantages previously held by America West. In addition, long-term
industry competitive reaction is unclear at this time, and there is potential for negative revenue impact on the industry and America West. However, given the
adverse impacts to our revenues in 2004 from increased LCC competition and increased legacy carrier response, we believe that the incremental effect of the
Delta initiative will be smaller than it would have been had the Delta fare initiative occurred earlier.
Customer Service
Continued emphasis on customer service is essential to growing our business and leisure traffic. Therefore, we are committed to building a successful
airline by taking care of our customers.
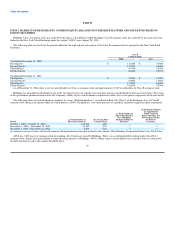
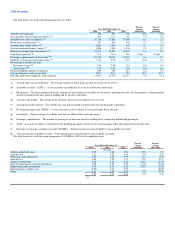
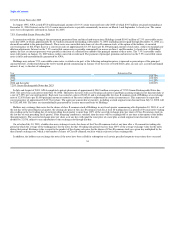
AWA reported the following operating statistics to the DOT for 2004, 2003, and 2002:
Percent Change Percent Change
2004 2003 2002 2004 – 2003 2004 – 2002
On-time performance (a) 75.7 82.0 82.9 (7.7) (8.7)
Completion factor (b) 98.4 99.0 99.0 (0.6) (0.6)
Mishandled baggage (c) 3.98 3.30 3.55 20.6 12.1
Customer complaints (d) 1.02 0.84 1.63 21.4 (37.4)
(a) Percentage of reported flight operations arriving on time.
(b) Percentage of scheduled flight operations completed.
(c) Rate of mishandled baggage reports per 1,000 passengers.
(d) Rate of customer complaints filed with the DOT per 100,000 passengers.
2004 proved to be a challenging year from an operations performance perspective. AWA made a business decision to increase aircraft utilization
approximately 10%, in order to increase revenues and reduce unit costs. This increased utilization came through a combination of increased night flying
through the Las Vegas hub and the creation of flight opportunities during the day when some aircraft previously sat on the ground for extended periods.
Additionally, 2004 was a difficult year from an Air Traffic Control or "ATC" perspective. The growth in FAA
24