Tyson Foods 2013 Annual Report Download - page 80
Download and view the complete annual report
Please find page 80 of the 2013 Tyson Foods annual report below. You can navigate through the pages in the report by either clicking on the pages listed below, or by using the keyword search tool below to find specific information within the annual report.-
 1
1 -
2
-
3
-
4
-
5
-
6
-
7
-
8
-
9
-
10
-
11
-
12
-
13
-
14
-
15
-
16
-
17
-
18
-
19
-
20
-
21
-
22
-
23
-
24
-
25
-
26
-
27
-
28
-
29
-
30
-
31
-
32
-
33
-
34
-
35
-
36
-
37
-
38
-
39
-
40
-
41
-
42
-
43
-
44
-
45
-
46
-
47
-
48
-
49
-
50
-
51
-
52
-
53
-
54
-
55
-
56
-
57
-
58
-
59
-
60
-
61
-
62
-
63
-
64
-
65
-
66
-
67
-
68
-
69
-
 70
70 -
 71
71 -
 72
72 -
 73
73 -
 74
74 -
 75
75 -
 76
76 -
 77
77 -
 78
78 -
 79
79 -
 80
80 -
 81
81 -
 82
82 -
 83
83 -
 84
84 -
 85
85 -
 86
86 -
 87
87 -
 88
88 -
 89
89 -
 90
90 -
91
-
92
-
93
-
94
-
95
-
96
 |
 |

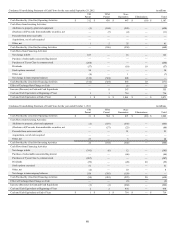
80
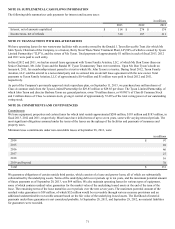
Condensed Consolidating Statement of Cash Flows for the year ended September 29, 2012 in millions
TFI
Parent TFM
Parent Non-
Guarantors Eliminations Total
Cash Provided by (Used for) Operating Activities $ 312 $ 438 $ 447 $ (10) $ 1,187
Cash Flows from Investing Activities:
Additions to property, plant and equipment (1) (104) (585) — (690)
(Purchases of)/Proceeds from marketable securities, net — (7) (4) — (11)
Proceeds from notes receivable —————
Acquisitions, net of cash acquired —————
Other, net 1 5 35 — 41
Cash Provided by (Used for) Investing Activities — (106) (554) — (660)
Cash Flows from Financing Activities:
Net change in debt 107 — 16 — 123
Purchase of redeemable noncontrolling interest —————
Purchases of Tyson Class A common stock (264) — — — (264)
Dividends (57) — (10) 10 (57)
Stock options exercised 34———34
Other, net (8) — 1 — (7)
Net change in intercompany balances (124) (324) 448 — —
Cash Provided by (Used for) Financing Activities (312) (324) 455 10 (171)
Effect of Exchange Rate Change on Cash — — (1) — (1)
Increase (Decrease) in Cash and Cash Equivalents — 8 347 — 355
Cash and Cash Equivalents at Beginning of Year 1 1 714 — 716
Cash and Cash Equivalents at End of Year $ 1 $ 9 $ 1,061 $ — $ 1,071
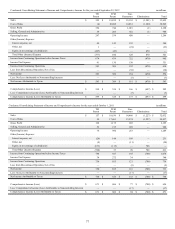
Condensed Consolidating Statement of Cash Flows for the year ended October 1, 2011 in millions
TFI
Parent TFM
Parent Non-
Guarantors Eliminations Total
Cash Provided by (Used for) Operating Activities $ 31 $ 564 $ 471 $ (20) $ 1,046
Cash Flows from Investing Activities:
Additions to property, plant and equipment (1) (107) (535) — (643)
(Purchases of)/Proceeds from marketable securities, net — (57) (23) — (80)
Proceeds from notes receivable ——51—51
Acquisitions, net of cash acquired —————
Other, net 23 — 5 — 28
Cash Provided by (Used for) Investing Activities 22 (164) (502) — (644)
Cash Flows from Financing Activities:
Net change in debt (391) (6) 12 — (385)
Purchase of redeemable noncontrolling interest — — (66) — (66)
Purchases of Tyson Class A common stock (207) — — — (207)
Dividends (59) — (20) 20 (59)
Stock options exercised 51———51
Other, net (2) — 10 — 8
Net change in intercompany balances 554 (395) (159) — —
Cash Provided by (Used for) Financing Activities (54) (401) (223) 20 (658)
Effect of Exchange Rate Change on Cash — — (6) — (6)
Increase (Decrease) in Cash and Cash Equivalents (1) (1) (260) — (262)
Cash and Cash Equivalents at Beginning of Year 2 2 974 — 978
Cash and Cash Equivalents at End of Year $ 1 $ 1 $ 714 $ — $ 716