Tyson Foods 2013 Annual Report Download - page 77
Download and view the complete annual report
Please find page 77 of the 2013 Tyson Foods annual report below. You can navigate through the pages in the report by either clicking on the pages listed below, or by using the keyword search tool below to find specific information within the annual report.-
 1
1 -
2
-
3
-
4
-
5
-
6
-
7
-
8
-
9
-
10
-
11
-
12
-
13
-
14
-
15
-
16
-
17
-
18
-
19
-
20
-
21
-
22
-
23
-
24
-
25
-
26
-
27
-
28
-
29
-
30
-
31
-
32
-
33
-
34
-
35
-
36
-
37
-
38
-
39
-
40
-
41
-
42
-
43
-
44
-
45
-
46
-
47
-
48
-
49
-
50
-
51
-
52
-
53
-
54
-
55
-
56
-
57
-
58
-
59
-
60
-
61
-
62
-
63
-
64
-
65
-
66
-
 67
67 -
 68
68 -
 69
69 -
 70
70 -
 71
71 -
 72
72 -
 73
73 -
 74
74 -
 75
75 -
 76
76 -
 77
77 -
 78
78 -
 79
79 -
 80
80 -
 81
81 -
 82
82 -
 83
83 -
 84
84 -
 85
85 -
 86
86 -
 87
87 -
88
-
89
-
90
-
91
-
92
-
93
-
94
-
95
-
96
 |
 |

77
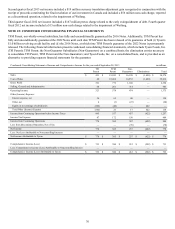
Condensed Consolidating Statement of Income and Comprehensive Income for the year ended September 29, 2012 in millions
TFI
Parent TFM
Parent Non-
Guarantors Eliminations Total
Sales $ 352 $ 18,832 $ 15,152 $ (1,281) $ 33,055
Cost of Sales (4) 18,088 14,061 (1,280) 30,865
Gross Profit 356 744 1,091 (1) 2,190
Selling, General and Administrative 59 205 641 (1) 904
Operating Income 297 539 450 — 1,286
Other (Income) Expense:
Interest expense, net 49 143 152 — 344
Other, net 1 — (24) — (23)
Equity in net earnings of subsidiaries (427) (43) — 470 —
Total Other (Income) Expense (377) 100 128 470 321
Income from Continuing Operations before Income Taxes 674 439 322 (470) 965
Income Tax Expense 91 130 130 — 351
Income from Continuing Operations 583 309 192 (470) 614
Loss from Discontinued Operation, Net of Tax — — (38) — (38)
Net Income 583 309 154 (470) 576
Less: Net Loss Attributable to Noncontrolling Interests — — (7) — (7)
Net Income Attributable to Tyson $ 583 $ 309 $ 161 $ (470) $ 583
Comprehensive Income (Loss) $ 599 $ 324 $ 166 $ (497) $ 592
Less: Comprehensive Income (Loss) Attributable to Noncontrolling Interests — — (7) — (7)
Comprehensive Income (Loss) Attributable to Tyson $ 599 $ 324 $ 173 $ (497) $ 599
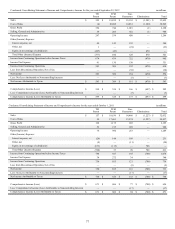
Condensed Consolidating Statement of Income and Comprehensive Income for the year ended October 1, 2011 in millions
TFI
Parent TFM
Parent Non-
Guarantors Eliminations Total
Sales $ 157 $ 18,636 $ 14,466 $ (1,227) $ 32,032
Cost of Sales 29 17,461 13,574 (1,227) 29,837
Gross Profit 128 1,175 892 — 2,195
Selling, General and Administrative 52 215 639 — 906
Operating Income 76 960 253 — 1,289
Other (Income) Expense:
Interest expense, net (26) 148 109 — 231
Other, net (9) — (11) — (20)
Equity in net earnings of subsidiaries (673) (115) — 788 —
Total Other (Income) Expense (708) 33 98 788 211
Income from Continuing Operations before Income Taxes 784 927 155 (788) 1,078
Income Tax Expense 34 272 34 — 340
Income from Continuing Operations 750 655 121 (788) 738
Loss from Discontinued Operation, Net of Tax — — (5) — (5)
Net Income 750 655 116 (788) 733
Less: Net Loss Attributable to Noncontrolling Interests — — (17) — (17)
Net Income Attributable to Tyson $ 750 $ 655 $ 133 $ (788) $ 750
Comprehensive Income (Loss) $ 671 $ 606 $ 77 $ (700) $ 654
Less: Comprehensive Income (Loss) Attributable to Noncontrolling Interests — — (17) — (17)
Comprehensive Income (Loss) Attributable to Tyson $ 671 $ 606 $ 94 $ (700) $ 671