Tyson Foods 2013 Annual Report Download - page 49
Download and view the complete annual report
Please find page 49 of the 2013 Tyson Foods annual report below. You can navigate through the pages in the report by either clicking on the pages listed below, or by using the keyword search tool below to find specific information within the annual report.-
 1
1 -
2
-
3
-
4
-
5
-
6
-
7
-
8
-
9
-
10
-
11
-
12
-
13
-
14
-
15
-
16
-
17
-
18
-
19
-
20
-
21
-
22
-
23
-
24
-
25
-
26
-
27
-
28
-
29
-
30
-
31
-
32
-
33
-
34
-
35
-
36
-
37
-
38
-
 39
39 -
 40
40 -
 41
41 -
 42
42 -
 43
43 -
 44
44 -
 45
45 -
 46
46 -
 47
47 -
 48
48 -
 49
49 -
 50
50 -
 51
51 -
 52
52 -
 53
53 -
 54
54 -
 55
55 -
 56
56 -
 57
57 -
 58
58 -
 59
59 -
60
-
61
-
62
-
63
-
64
-
65
-
66
-
67
-
68
-
69
-
70
-
71
-
72
-
73
-
74
-
75
-
76
-
77
-
78
-
79
-
80
-
81
-
82
-
83
-
84
-
85
-
86
-
87
-
88
-
89
-
90
-
91
-
92
-
93
-
94
-
95
-
96
 |
 |

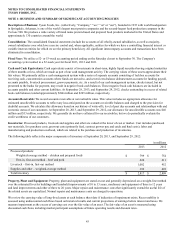
49
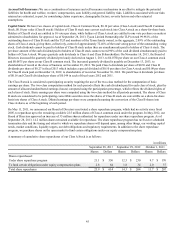
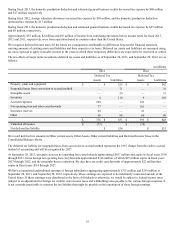
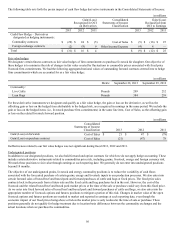
The following table reflects other intangible assets by type at September 28, 2013, and September 29, 2012:
in millions
2013 2012
Gross carrying value:
Trademarks $ 85 $ 56
Patents, intellectual property and other 152 142
Land use rights 8 21
Less accumulated amortization 107 90
Total intangible assets $ 138 $ 129
Beginning with the date benefits are realized, other intangible assets are generally amortized using the straight-line method over their
estimated period of benefit of three to 30 years. Amortization expense of $17 million, $16 million and $18 million was recognized
during fiscal 2013, 2012 and 2011, respectively. We estimate amortization expense on intangible assets for the next five fiscal years
subsequent to September 28, 2013, will be: 2014 - $18 million; 2015 - $18 million; 2016 - $17 million; 2017 - $14 million; 2018 - $13
million.
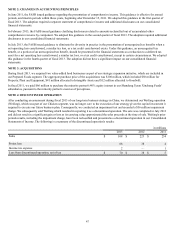
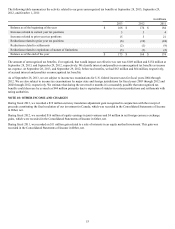
NOTE 7: OTHER CURRENT LIABILITIES
Other current liabilities at September 28, 2013, and September 29, 2012, include:
in millions
2013 2012
Accrued salaries, wages and benefits $ 419 $ 382
Self-insurance reserves 267 274
Other 452 287
Total other current liabilities $ 1,138 $ 943
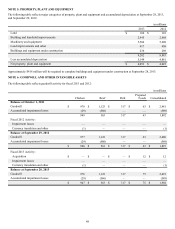
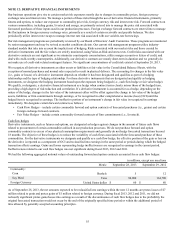
NOTE 8: DEBT
The following table reflects major components of debt as of September 28, 2013, and September 29, 2012:
in millions
2013 2012
Revolving credit facility $ — $ —
Senior notes:
3.25% Convertible senior notes due October 2013 (2013 Notes) 458 458
6.60% Senior notes due April 2016 (2016 Notes) 638 638
7.00% Notes due May 2018 120 120
4.50% Senior notes due June 2022 (2022 Notes) 1,000 1,000
7.00% Notes due January 2028 18 18
Discount on senior notes (6) (28)
GO Zone tax-exempt bonds due October 2033 (0.07% at 9/28/2013) 100 100
Other 80 126
Total debt 2,408 2,432
Less current debt 513 515
Total long-term debt $ 1,895 $ 1,917
Annual maturities of debt for the five fiscal years subsequent to September 28, 2013, are: 2014 - $514 million; 2015 - $12 million;
2016 - $645 million; 2017 - $4 million; 2018 - $120 million.