Tyson Foods 2013 Annual Report Download - page 57
Download and view the complete annual report
Please find page 57 of the 2013 Tyson Foods annual report below. You can navigate through the pages in the report by either clicking on the pages listed below, or by using the keyword search tool below to find specific information within the annual report.-
 1
1 -
2
-
3
-
4
-
5
-
6
-
7
-
8
-
9
-
10
-
11
-
12
-
13
-
14
-
15
-
16
-
17
-
18
-
19
-
20
-
21
-
22
-
23
-
24
-
25
-
26
-
27
-
28
-
29
-
30
-
31
-
32
-
33
-
34
-
35
-
36
-
37
-
38
-
39
-
40
-
41
-
42
-
43
-
44
-
45
-
46
-
 47
47 -
 48
48 -
 49
49 -
 50
50 -
 51
51 -
 52
52 -
 53
53 -
 54
54 -
 55
55 -
 56
56 -
 57
57 -
 58
58 -
 59
59 -
 60
60 -
 61
61 -
 62
62 -
 63
63 -
 64
64 -
 65
65 -
 66
66 -
 67
67 -
68
-
69
-
70
-
71
-
72
-
73
-
74
-
75
-
76
-
77
-
78
-
79
-
80
-
81
-
82
-
83
-
84
-
85
-
86
-
87
-
88
-
89
-
90
-
91
-
92
-
93
-
94
-
95
-
96
 |
 |

57
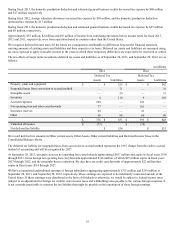
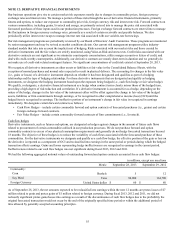
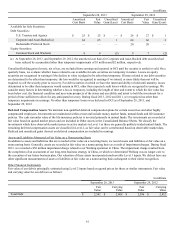
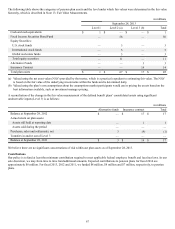
We have a foreign currency cash flow hedging program to hedge portions of forecasted transactions denominated in foreign
currencies, primarily with forward and option contracts, to protect against the reduction in value of forecasted foreign currency cash
flows. Our undesignated foreign currency positions generally would qualify for cash flow hedge accounting. However, to reduce
earnings volatility, we normally will not elect hedge accounting treatment when the position provides an offset to the underlying
related transaction that impacts current earnings.
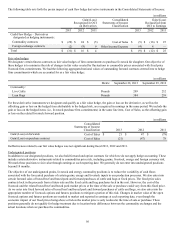
We had the following aggregate outstanding notional values related to our undesignated positions:
in millions, except soy meal tons
Metric September 28, 2013 September 29, 2012
Commodity:
Corn Bushels 69 19
Soy Meal Tons 204,600 1,200
Soy Oil Pounds 11 17
Live Cattle Pounds 60 68
Lean Hogs Pounds 159 108
Foreign Currency United States dollars $ 95 $ 165
The following table sets forth the pretax impact of the undesignated derivative instruments in the Consolidated Statements of Income:
in millions
Consolidated
Statements of Income
Classification
Gain/(Loss)
Recognized
in Earnings
2013 2012 2011
Derivatives not designated as hedging instruments:
Commodity contracts Sales $ (10) $ (10) $ 20
Commodity contracts Cost of Sales (24) 51 (2)
Foreign exchange contracts Other Income/Expense 2 — (3)
Total $(32) $ 41 $ 15