Tyson Foods 2013 Annual Report Download - page 62
Download and view the complete annual report
Please find page 62 of the 2013 Tyson Foods annual report below. You can navigate through the pages in the report by either clicking on the pages listed below, or by using the keyword search tool below to find specific information within the annual report.-
 1
1 -
2
-
3
-
4
-
5
-
6
-
7
-
8
-
9
-
10
-
11
-
12
-
13
-
14
-
15
-
16
-
17
-
18
-
19
-
20
-
21
-
22
-
23
-
24
-
25
-
26
-
27
-
28
-
29
-
30
-
31
-
32
-
33
-
34
-
35
-
36
-
37
-
38
-
39
-
40
-
41
-
42
-
43
-
44
-
45
-
46
-
47
-
48
-
49
-
50
-
51
-
 52
52 -
 53
53 -
 54
54 -
 55
55 -
 56
56 -
 57
57 -
 58
58 -
 59
59 -
 60
60 -
 61
61 -
 62
62 -
 63
63 -
 64
64 -
 65
65 -
 66
66 -
 67
67 -
 68
68 -
 69
69 -
 70
70 -
 71
71 -
 72
72 -
73
-
74
-
75
-
76
-
77
-
78
-
79
-
80
-
81
-
82
-
83
-
84
-
85
-
86
-
87
-
88
-
89
-
90
-
91
-
92
-
93
-
94
-
95
-
96
 |
 |

62
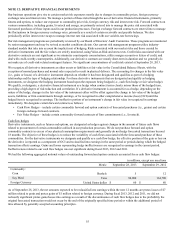
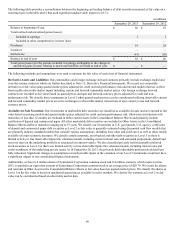
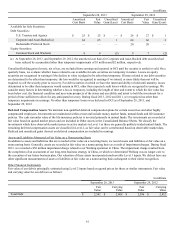
Concentrations of Credit Risk
Our financial instruments exposed to concentrations of credit risk consist primarily of cash and cash equivalents and accounts
receivable. Our cash equivalents are in high quality securities placed with major banks and financial institutions. Concentrations of
credit risk with respect to receivables are limited due to the large number of customers and their dispersion across geographic areas.
We perform periodic credit evaluations of our customers’ financial condition and generally do not require collateral. At September 28,
2013, and September 29, 2012, 17.5% and 17.1%, respectively, of our net accounts receivable balance was due from Wal-Mart Stores,
Inc. No other single customer or customer group represented greater than 10% of net accounts receivable.
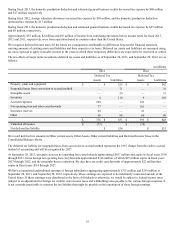
NOTE 14: STOCK-BASED COMPENSATION
We issue shares under our stock-based compensation plans by issuing Class A stock from treasury. The total number of shares
available for future grant under the Tyson Foods, Inc. 2000 Stock Incentive Plan (Incentive Plan) was 35,365,400 at September 28,
2013.
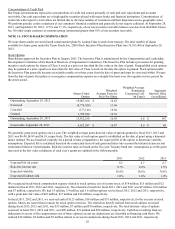
Stock Options
Shareholders approved the Incentive Plan in January 2001. The Incentive Plan is administered by the Compensation and Leadership
Development Committee of the Board of Directors (Compensation Committee). The Incentive Plan includes provisions for granting
incentive stock options for shares of Class A stock at a price not less than the fair value at the date of grant. Nonqualified stock options
may be granted at a price equal to or more than the fair value of Class A stock on the date the option is granted. Stock options under
the Incentive Plan generally become exercisable ratably over three years from the date of grant and must be exercised within 10 years
from the date of grant. Our policy is to recognize compensation expense on a straight-line basis over the requisite service period for
the entire award.
Shares Under
Option
Weighted
Average Exercise
Price Per Share
Weighted Average
Remaining
Contractual Life
(in Years)
Aggregate
Intrinsic Value
(in millions)
Outstanding, September 29, 2012 19,067,360 $ 14.82
Exercised (8,778,028) 13.96
Canceled (177,144) 16.04
Granted 3,799,980 19.36
Outstanding, September 28, 2013 13,912,168 16.59 6.8 $ 167
Exercisable, September 28, 2013 6,423,287 $ 14.87 4.9 $ 88
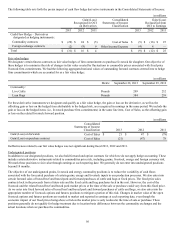
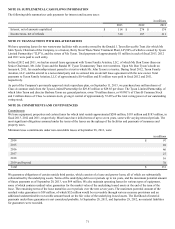
We generally grant stock options once a year. The weighted average grant-date fair value of options granted in fiscal 2013, 2012 and
2011 was $6.44, $6.99 and $6.19, respectively. The fair value of each option grant is established on the date of grant using a binomial
lattice method. We use historical volatility for a period of time comparable to the expected life of the option to determine volatility
assumptions. Expected life is calculated based on the contractual term of each grant and takes into account the historical exercise and
termination behavior of participants. Risk-free interest rates are based on the five-year Treasury bond rate. Assumptions as of the grant
date used in the fair value calculation of each year’s grants are outlined in the following table.
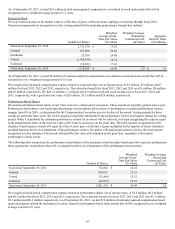
2013 2012 2011
Expected life (in years) 6.2 6.7 6.7
Risk-free interest rate 0.7% 0.9% 1.5%
Expected volatility 36.8% 36.6% 38.8%
Expected dividend yield 1.0% 1.0% 1.0%
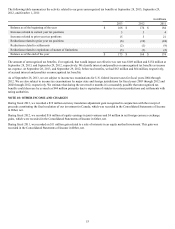
We recognized stock-based compensation expense related to stock options, net of income taxes, of $14 million, $15 million and $12
million for fiscal 2013, 2012 and 2011, respectively. The related tax benefit for fiscal 2013, 2012 and 2011 was $9 million, $10 million
and $7 million, respectively. We had 3.9 million, 3.4 million and 3.8 million options vest in fiscal 2013, 2012 and 2011, respectively,
with a grant date fair value of $22 million, $17 million and $16 million, respectively.
In fiscal 2013, 2012 and 2011, we received cash of $123 million, $34 million and $51 million, respectively, for the exercise of stock
options. Shares are issued from treasury for stock option exercises. The related tax benefit realized from stock options exercised
during fiscal 2013, 2012 and 2011, was $35 million, $7 million and $10 million, respectively. The total intrinsic value of options
exercised in fiscal 2013, 2012 and 2011, was $90 million, $21 million and $26 million, respectively. Cash flows resulting from tax
deductions in excess of the compensation cost of those options (excess tax deductions) are classified as financing cash flows. We
realized $18 million, $3 million and $5 million related to excess tax deductions during fiscal 2013, 2012 and 2011, respectively.