Tyson Foods 2013 Annual Report Download - page 27
Download and view the complete annual report
Please find page 27 of the 2013 Tyson Foods annual report below. You can navigate through the pages in the report by either clicking on the pages listed below, or by using the keyword search tool below to find specific information within the annual report.-
 1
1 -
2
-
3
-
4
-
5
-
6
-
7
-
8
-
9
-
10
-
11
-
12
-
13
-
14
-
15
-
16
-
 17
17 -
 18
18 -
 19
19 -
 20
20 -
 21
21 -
 22
22 -
 23
23 -
 24
24 -
 25
25 -
 26
26 -
 27
27 -
 28
28 -
 29
29 -
 30
30 -
 31
31 -
 32
32 -
 33
33 -
 34
34 -
 35
35 -
 36
36 -
 37
37 -
38
-
39
-
40
-
41
-
42
-
43
-
44
-
45
-
46
-
47
-
48
-
49
-
50
-
51
-
52
-
53
-
54
-
55
-
56
-
57
-
58
-
59
-
60
-
61
-
62
-
63
-
64
-
65
-
66
-
67
-
68
-
69
-
70
-
71
-
72
-
73
-
74
-
75
-
76
-
77
-
78
-
79
-
80
-
81
-
82
-
83
-
84
-
85
-
86
-
87
-
88
-
89
-
90
-
91
-
92
-
93
-
94
-
95
-
96
 |
 |

27
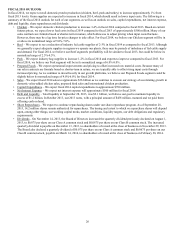
LIQUIDITY AND CAPITAL RESOURCES
Our cash needs for working capital, capital expenditures, growth opportunities, the repurchases of senior notes and share
repurchases are expected to be met with current cash on hand, cash flows provided by operating activities, or short-term
borrowings. Based on our current expectations, we believe our liquidity and capital resources will be sufficient to operate our
business. However, we may take advantage of opportunities to generate additional liquidity or refinance existing debt through
capital market transactions. The amount, nature and timing of any capital market transactions will depend on our operating
performance and other circumstances; our then-current commitments and obligations; the amount, nature and timing of our capital
requirements; any limitations imposed by our current credit arrangements; and overall market conditions.
Cash Flows from Operating Activities in millions
2013 2012 2011
Net income $ 778 $ 576 $ 733
Non-cash items in net income:
Depreciation and amortization 519 499 506
Deferred income taxes (12) 140 86
Loss on early extinguishment of debt — 167 —
Impairment of assets 74 34 18
Other, net 26 18 49
Net changes in working capital (71)(247) (346)
Net cash provided by operating activities $ 1,314 $ 1,187 $ 1,046
• Cash flows associated with Loss on early extinguishment of debt included the amount paid exceeding the par value of debt,
unamortized discount and unamortized debt issuance costs related to the full extinguishment of the 2014 Notes.
• Cash flows associated with changes in working capital:
• 2013 – Decreased primarily due to a higher accounts receivable balance, partially offset by increases in accrued salaries,
wages and benefits and income tax payable. The higher accounts receivable balance is largely due to significant
increases in input costs and price increases associated with the increased input costs.
• 2012 – Decreased due to the increase in inventory and accounts receivable balances, partially offset by the increase in
accounts payable. The higher inventory and accounts receivable balances were driven by significant increases in input
costs and price increases associated with the increased input costs.
• 2011 – Decreased due to the increase in inventory and accounts receivable balances, partially offset by the increase in
accounts payable. The higher inventory and accounts receivable balances were driven by significant increases in input
costs and price increases associated with the increased input costs.
Cash Flows from Investing Activities in millions
2013 2012 2011
Additions to property, plant and equipment $(558) $ (690) $ (643)
Purchases of marketable securities, net (18)(11) (80)
Proceeds from notes receivable — — 51
Acquisitions, net of cash acquired (106) — —
Other, net 39 41 28
Net cash used for investing activities $(643) $ (660) $ (644)
• Additions to property, plant and equipment include acquiring new equipment and upgrading our facilities to maintain
competitive standing and position us for future opportunities. In fiscal 2013, 2012, and 2011, our capital spending was
primarily for production efficiencies in our operations and for ongoing development of foreign operations.
• Capital spending for fiscal 2014 is expected to approximate $700 million, and will include spending on our operations
for production and labor efficiencies, yield improvements and sales channel flexibility, as well as expansion of our
foreign operations.
• Purchases of marketable securities included funding for our deferred compensation plans.
• Proceeds from notes receivable totaling $51 million in fiscal 2011 related to the collection of notes receivable received in
conjunction with the sale of a business operation in fiscal 2009.
• Acquisitions in fiscal 2013 related to acquiring two value-added food businesses as part of our strategic expansion
initiative which are included in our Prepared Foods segment.