Tyson Foods 2013 Annual Report Download - page 39
Download and view the complete annual report
Please find page 39 of the 2013 Tyson Foods annual report below. You can navigate through the pages in the report by either clicking on the pages listed below, or by using the keyword search tool below to find specific information within the annual report.-
 1
1 -
2
-
3
-
4
-
5
-
6
-
7
-
8
-
9
-
10
-
11
-
12
-
13
-
14
-
15
-
16
-
17
-
18
-
19
-
20
-
21
-
22
-
23
-
24
-
25
-
26
-
27
-
28
-
 29
29 -
 30
30 -
 31
31 -
 32
32 -
 33
33 -
 34
34 -
 35
35 -
 36
36 -
 37
37 -
 38
38 -
 39
39 -
 40
40 -
 41
41 -
 42
42 -
 43
43 -
 44
44 -
 45
45 -
 46
46 -
 47
47 -
 48
48 -
 49
49 -
50
-
51
-
52
-
53
-
54
-
55
-
56
-
57
-
58
-
59
-
60
-
61
-
62
-
63
-
64
-
65
-
66
-
67
-
68
-
69
-
70
-
71
-
72
-
73
-
74
-
75
-
76
-
77
-
78
-
79
-
80
-
81
-
82
-
83
-
84
-
85
-
86
-
87
-
88
-
89
-
90
-
91
-
92
-
93
-
94
-
95
-
96
 |
 |
39
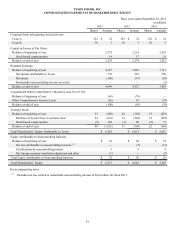
TYSON FOODS, INC.
CONSOLIDATED STATEMENTS OF COMPREHENSIVE INCOME
Three years ended September 28, 2013
in millions
2013 2012 2011
Net Income $ 778 $ 576 $ 733
Other Comprehensive Income (Loss), Net of Taxes:
Derivatives accounted for as cash flow hedges (14) 17 (17)
Investments (3) — (8)
Currency translation (37) 3 (41)
Postretirement benefits 9(4) (13)
Total Other Comprehensive Income (Loss), Net of Taxes (45) 16 (79)
Comprehensive Income 733 592 654
Less: Comprehensive Income (Loss) Attributable to Noncontrolling Interests —(7) (17)
Comprehensive Income Attributable to Tyson $ 733 $ 599 $ 671
See accompanying notes.