Tyson Foods 2013 Annual Report Download - page 42
Download and view the complete annual report
Please find page 42 of the 2013 Tyson Foods annual report below. You can navigate through the pages in the report by either clicking on the pages listed below, or by using the keyword search tool below to find specific information within the annual report.-
 1
1 -
2
-
3
-
4
-
5
-
6
-
7
-
8
-
9
-
10
-
11
-
12
-
13
-
14
-
15
-
16
-
17
-
18
-
19
-
20
-
21
-
22
-
23
-
24
-
25
-
26
-
27
-
28
-
29
-
30
-
31
-
 32
32 -
 33
33 -
 34
34 -
 35
35 -
 36
36 -
 37
37 -
 38
38 -
 39
39 -
 40
40 -
 41
41 -
 42
42 -
 43
43 -
 44
44 -
 45
45 -
 46
46 -
 47
47 -
 48
48 -
 49
49 -
 50
50 -
 51
51 -
 52
52 -
53
-
54
-
55
-
56
-
57
-
58
-
59
-
60
-
61
-
62
-
63
-
64
-
65
-
66
-
67
-
68
-
69
-
70
-
71
-
72
-
73
-
74
-
75
-
76
-
77
-
78
-
79
-
80
-
81
-
82
-
83
-
84
-
85
-
86
-
87
-
88
-
89
-
90
-
91
-
92
-
93
-
94
-
95
-
96
 |
 |
42
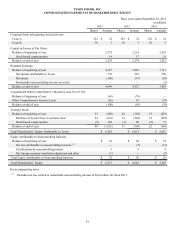
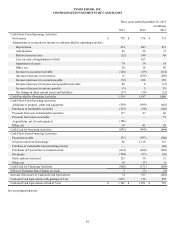
TYSON FOODS, INC.
CONSOLIDATED STATEMENTS OF CASH FLOWS
Three years ended September 28, 2013
in millions
2013 2012 2011
Cash Flows From Operating Activities:
Net income $ 778 $ 576 $ 733
Adjustments to reconcile net income to cash provided by operating activities:
Depreciation 474 443 433
Amortization 45 56 73
Deferred income taxes (12) 140 86
Loss on early extinguishment of debt — 167 —
Impairment of assets 74 34 18
Other, net 26 18 49
Increase in accounts receivable (126)(69) (114)
(Increase) decrease in inventories 15 (259) (299)
Increase (decrease) in accounts payable (12) 106 152
Increase (decrease) in income taxes payable/receivable 80 8 (73)
Increase (decrease) in interest payable (1) 5 19
Net change in other current assets and liabilities (27)(38) (31)
Cash Provided by Operating Activities 1,314 1,187 1,046
Cash Flows From Investing Activities:
Additions to property, plant and equipment (558)(690) (643)
Purchases of marketable securities (135)(58) (146)
Proceeds from sale of marketable securities 117 47 66
Proceeds from notes receivable — — 51
Acquisitions, net of cash acquired (106) — —
Other, net 39 41 28
Cash Used for Investing Activities (643)(660) (644)
Cash Flows From Financing Activities:
Payments on debt (91)(993) (500)
Net proceeds from borrowings 68 1,116 115
Purchase of redeemable noncontrolling interest — — (66)
Purchases of Tyson Class A common stock (614)(264) (207)
Dividends (104)(57) (59)
Stock options exercised 123 34 51
Other, net 18 (7) 8
Cash Used for Financing Activities (600)(171) (658)
Effect of Exchange Rate Change on Cash 3 (1) (6)
Increase (Decrease) in Cash and Cash Equivalents 74 355 (262)
Cash and Cash Equivalents at Beginning of Year 1,071 716 978
Cash and Cash Equivalents at End of Year $ 1,145 $ 1,071 $ 716
See accompanying notes.