Tyson Foods 2013 Annual Report Download - page 17
Download and view the complete annual report
Please find page 17 of the 2013 Tyson Foods annual report below. You can navigate through the pages in the report by either clicking on the pages listed below, or by using the keyword search tool below to find specific information within the annual report.-
 1
1 -
2
-
3
-
4
-
5
-
6
-
 7
7 -
 8
8 -
 9
9 -
 10
10 -
 11
11 -
 12
12 -
 13
13 -
 14
14 -
 15
15 -
 16
16 -
 17
17 -
 18
18 -
 19
19 -
 20
20 -
 21
21 -
 22
22 -
 23
23 -
 24
24 -
 25
25 -
 26
26 -
 27
27 -
28
-
29
-
30
-
31
-
32
-
33
-
34
-
35
-
36
-
37
-
38
-
39
-
40
-
41
-
42
-
43
-
44
-
45
-
46
-
47
-
48
-
49
-
50
-
51
-
52
-
53
-
54
-
55
-
56
-
57
-
58
-
59
-
60
-
61
-
62
-
63
-
64
-
65
-
66
-
67
-
68
-
69
-
70
-
71
-
72
-
73
-
74
-
75
-
76
-
77
-
78
-
79
-
80
-
81
-
82
-
83
-
84
-
85
-
86
-
87
-
88
-
89
-
90
-
91
-
92
-
93
-
94
-
95
-
96
 |
 |
17
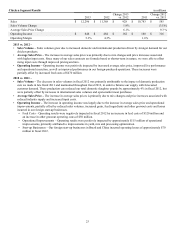
PERFORMANCE GRAPH
The following graph shows a five-year comparison of cumulative total returns for our Class A stock, the Standard & Poor’s (S&P) 500
Index and a group of peer companies described below.
Fiscal Years Ending
Base Period
9/27/08 10/3/09 10/2/10 10/1/11 9/29/12 9/28/13
Tyson Foods, Inc. $ 100.00 $ 98.76 $ 131.69 $ 141.88 $ 132.08 $ 249.51
S&P 500 Index 100.00 93.09 102.55 103.72 135.05 161.17
Previous Peer Group 100.00 90.91 107.82 119.21 133.98 147.62
Current Peer Group 100.00 94.35 107.96 113.44 128.37 146.05
The total cumulative return on investment (change in the year-end stock price plus reinvested dividends), which is based on the stock
price or composite index at the end of fiscal 2008, is presented for each of the periods for the Company, the S&P 500 Index, the
previous peer group and the current peer group. Beginning in fiscal 2013, the Company’s Compensation and Leadership Development
Committee selected a new peer group to more accurately reflect the Company’s peers in terms of industry standing and compensation
benchmarking. The previous peer group includes: Campbell Soup Company, ConAgra Foods, Inc., General Mills, Inc., H.J. Heinz Co.
(up to June 7, 2013), Hershey Foods Corp., Hormel Foods Corp., Kellogg Co., McCormick & Co., Pilgrim’s Pride Corporation, Sara
Lee Corp. (up to June 28, 2012), Hillshire Brands Co. (beginning on June 28, 2012) and Smithfield Foods, Inc. (up to September 26,
2013). The current peer group includes: Archer-Daniels-Midland Company, Bunge Limited, Campbell Soup Company, ConAgra
Foods, Inc., Dean Foods Company, General Mills, Inc., H.J. Heinz Co. (up to June 7, 2013), Hillshire Brands Co. (beginning on June
28, 2012), Hormel Foods Corp., Kellog Co., Kraft Foods Group Inc., McCormick & Co., Pilgrim's Pride Corporation, Sanderson
Farms, Inc., Smithfield Foods, Inc. (up to September 26, 2013) and The J.M. Smucker Company. H.J. Heinz Co. and Smithfield
Foods, Inc. were removed at the time their shares ceased public trading. Sara Lee Corp. changed its name to Hillshire Brands Co.
following a spin-off of certain of its international businesses. The graph compares the performance of the Company with that of the
S&P 500 Index and both peer groups, with the investment weighted on market capitalization.