Tyson Foods 2013 Annual Report Download - page 75
Download and view the complete annual report
Please find page 75 of the 2013 Tyson Foods annual report below. You can navigate through the pages in the report by either clicking on the pages listed below, or by using the keyword search tool below to find specific information within the annual report.-
 1
1 -
2
-
3
-
4
-
5
-
6
-
7
-
8
-
9
-
10
-
11
-
12
-
13
-
14
-
15
-
16
-
17
-
18
-
19
-
20
-
21
-
22
-
23
-
24
-
25
-
26
-
27
-
28
-
29
-
30
-
31
-
32
-
33
-
34
-
35
-
36
-
37
-
38
-
39
-
40
-
41
-
42
-
43
-
44
-
45
-
46
-
47
-
48
-
49
-
50
-
51
-
52
-
53
-
54
-
55
-
56
-
57
-
58
-
59
-
60
-
61
-
62
-
63
-
64
-
 65
65 -
 66
66 -
 67
67 -
 68
68 -
 69
69 -
 70
70 -
 71
71 -
 72
72 -
 73
73 -
 74
74 -
 75
75 -
 76
76 -
 77
77 -
 78
78 -
 79
79 -
 80
80 -
 81
81 -
 82
82 -
 83
83 -
 84
84 -
 85
85 -
86
-
87
-
88
-
89
-
90
-
91
-
92
-
93
-
94
-
95
-
96
 |
 |

75
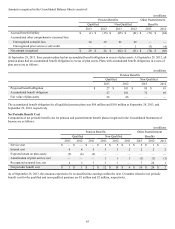
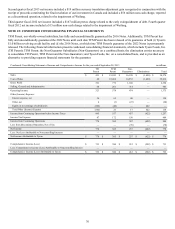
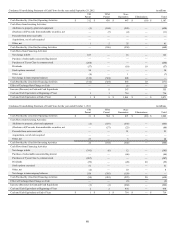
NOTE 21: QUARTERLY FINANCIAL DATA (UNAUDITED)
in millions, except per share data
First
Quarter Second
Quarter Third
Quarter Fourth
Quarter
2013
Sales $ 8,366 $ 8,383 $ 8,731 $ 8,894
Gross profit 539 468 682 669
Operating income 304 236 419 416
Net income 168 106 245 259
Amounts attributable to Tyson:
Net income from continuing operations 177 157 253 261
Net loss from discontinued operation (4)(62)(4) —
Net income attributable to Tyson 173 95 249 261
Net income per share from continuing operations attributable to Tyson:
Class A Basic $ 0.51 $ 0.45 $ 0.73 $ 0.77
Class B Basic $ 0.46 $ 0.40 $ 0.66 $ 0.70
Diluted $ 0.49 $ 0.43 $ 0.69 $ 0.70
Net loss per share from discontinued operation attributable to Tyson:
Class A Basic $ (0.01) $ (0.18) $ (0.01) $ —
Class B Basic $ (0.01) $ (0.15) $ (0.02) $ —
Diluted $ (0.01) $ (0.17) $ (0.01) $ —
Net income per share attributable to Tyson:
Class A Basic $ 0.50 $ 0.27 $ 0.72 $ 0.77
Class B Basic $ 0.45 $ 0.25 $ 0.64 $ 0.70
Diluted $ 0.48 $ 0.26 $ 0.68 $ 0.70
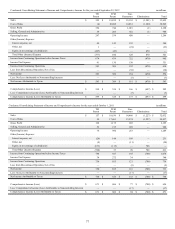
2012
Sales $ 8,258 $ 8,221 $ 8,261 $ 8,315
Gross profit 497 537 566 590
Operating income 284 306 342 354
Net income 156 166 73 181
Amounts attributable to Tyson:
Net income from continuing operations 162 170 82 207
Net loss from discontinued operation (6)(4)(6) (22)
Net income attributable to Tyson 156 166 76 185
Net income per share from continuing operations attributable to Tyson:
Class A Basic $ 0.45 $ 0.48 $ 0.23 $ 0.59
Class B Basic $ 0.41 $ 0.43 $ 0.20 $ 0.53
Diluted $ 0.43 $ 0.46 $ 0.22 $ 0.57
Net loss per share from discontinued operation attributable to Tyson:
Class A Basic $ (0.02) $ (0.01) $ (0.02) $ (0.06)
Class B Basic $ (0.02) $ (0.01) $ (0.01) $ (0.05)
Diluted $ (0.01) $ (0.02) $ (0.01) $ (0.06)
Net income per share attributable to Tyson:
Class A Basic $ 0.43 $ 0.47 $ 0.21 $ 0.53
Class B Basic $ 0.39 $ 0.42 $ 0.19 $ 0.48
Diluted $ 0.42 $ 0.44 $ 0.21 $ 0.51