Tyson Foods 2013 Annual Report Download - page 19
Download and view the complete annual report
Please find page 19 of the 2013 Tyson Foods annual report below. You can navigate through the pages in the report by either clicking on the pages listed below, or by using the keyword search tool below to find specific information within the annual report.-
 1
1 -
2
-
3
-
4
-
5
-
6
-
7
-
8
-
 9
9 -
 10
10 -
 11
11 -
 12
12 -
 13
13 -
 14
14 -
 15
15 -
 16
16 -
 17
17 -
 18
18 -
 19
19 -
 20
20 -
 21
21 -
 22
22 -
 23
23 -
 24
24 -
 25
25 -
 26
26 -
 27
27 -
 28
28 -
 29
29 -
30
-
31
-
32
-
33
-
34
-
35
-
36
-
37
-
38
-
39
-
40
-
41
-
42
-
43
-
44
-
45
-
46
-
47
-
48
-
49
-
50
-
51
-
52
-
53
-
54
-
55
-
56
-
57
-
58
-
59
-
60
-
61
-
62
-
63
-
64
-
65
-
66
-
67
-
68
-
69
-
70
-
71
-
72
-
73
-
74
-
75
-
76
-
77
-
78
-
79
-
80
-
81
-
82
-
83
-
84
-
85
-
86
-
87
-
88
-
89
-
90
-
91
-
92
-
93
-
94
-
95
-
96
 |
 |

19
ITEM 7. MANAGEMENT’S DISCUSSION AND ANALYSIS OF FINANCIAL CONDITION AND RESULTS OF
OPERATIONS
DESCRIPTION OF THE COMPANY
We are one of the world’s largest meat protein companies and the second-largest food production company in the Fortune 500 with
one of the most recognized brand names in the food industry. We produce, distribute and market chicken, beef, pork, prepared foods
and related allied products. Our operations are conducted in four segments: Chicken, Beef, Pork and Prepared Foods. Some of the key
factors influencing our business are customer demand for our products; the ability to maintain and grow relationships with customers
and introduce new and innovative products to the marketplace; accessibility of international markets; market prices for our products;
the cost and availability of live cattle and hogs, raw materials, feed ingredients; and operating efficiencies of our facilities.
OVERVIEW
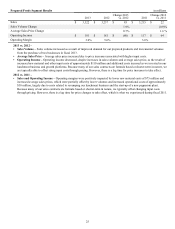
• General – Operating income grew 7% in fiscal 2013 over fiscal 2012, which was led by record earnings in our Chicken
segment and improved performance in our Beef segment. Revenues increased 4% to a record $34.4 billion, driven by price
and mix improvements. We were able to overcome a $1.2 billion increase in input costs through strong operational
execution and margin management. The following are a few of the key drivers:
• We continued to execute our strategy of accelerating growth in domestic value-added chicken sales, prepared food
sales and international chicken production, innovating products, services and customer insights and cultivating our
talent development to support Tyson's growth for the future.
• Market environment – Our Chicken segment delivered record results in fiscal 2013 driven by strong demand and
favorable domestic market conditions. The Chicken segment experienced increased feed costs but was able to offset
the impact with operational, mix and price improvements. Our Beef segment’s operating performance improved,
despite lower domestic availability of fed cattle supplies, due to better operational execution, less volatile live cattle
markets, and stronger export markets. Our Pork segment results remained within its normalized operating margin
range, but were down slightly from last year due to periods of increased domestic availability of pork products. Our
Prepared Foods segment was challenged by product mix and rapidly increasing raw material prices.
• Discontinued Operation – After conducting an assessment during fiscal 2013 of our long-term business strategy in China,
we determined our Weifang operation (Weifang), which was part of our Chicken segment, was no longer core to the
execution of our strategy given the capital investment it required to execute our future business plan. We completed the
sale of Weifang in July 2013. Weifang's results are reported as a discontinued operation for all periods presented.
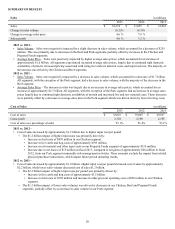
• Margins – Our total operating margin was 4.0% in fiscal 2013. Operating margins by segment were as follows:
• Chicken – 5.3% Beef – 2.1% Pork – 6.1% Prepared Foods – 3.0%
• Debt and Liquidity – During fiscal 2013, we generated $1.3 billion of operating cash flows. We repurchased 21.1 million
shares of our stock for $550 million under our share repurchase program in fiscal 2013. At September 28, 2013, we had
$2.1 billion of liquidity, which includes the availability under our credit facility and $1.1 billion of cash and cash
equivalents.
• Our accounting cycle resulted in a 52-week year for fiscal 2013, 2012 and 2011.
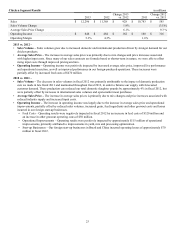
in millions, except per share data
2013 2012 2011
Net income from continuing operations attributable to Tyson $ 848 $ 621 $ 752
Net income from continuing operations attributable to Tyson – per diluted share 2.31 1.68 1.98
Net loss from discontinued operation attributable to Tyson (70)(38) (2)
Net loss from discontinued operation attributable to Tyson – per diluted share (0.19)(0.10) (0.01)
Net income attributable to Tyson 778 583 750
Net income attributable to Tyson - per diluted share 2.12 1.58 1.97
2013 – Net income included the following item:
• $19 million, or $0.05 per diluted share, related to recognized currency translation adjustment gain.
2012 – Net income included the following item:
• $167 million pretax charge, or $0.29 per diluted share, related to the early extinguishment of debt.
2011 – Net income included the following items:
• $11 million gain, or $0.03 per diluted share, related to a sale of interests in an equity method investment; and
• $21 million reduction to income tax expense, or $0.05 per diluted share, related to a reversal of reserves for foreign
uncertain tax positions.