Tyson Foods 2013 Annual Report Download - page 78
Download and view the complete annual report
Please find page 78 of the 2013 Tyson Foods annual report below. You can navigate through the pages in the report by either clicking on the pages listed below, or by using the keyword search tool below to find specific information within the annual report.-
 1
1 -
2
-
3
-
4
-
5
-
6
-
7
-
8
-
9
-
10
-
11
-
12
-
13
-
14
-
15
-
16
-
17
-
18
-
19
-
20
-
21
-
22
-
23
-
24
-
25
-
26
-
27
-
28
-
29
-
30
-
31
-
32
-
33
-
34
-
35
-
36
-
37
-
38
-
39
-
40
-
41
-
42
-
43
-
44
-
45
-
46
-
47
-
48
-
49
-
50
-
51
-
52
-
53
-
54
-
55
-
56
-
57
-
58
-
59
-
60
-
61
-
62
-
63
-
64
-
65
-
66
-
67
-
 68
68 -
 69
69 -
 70
70 -
 71
71 -
 72
72 -
 73
73 -
 74
74 -
 75
75 -
 76
76 -
 77
77 -
 78
78 -
 79
79 -
 80
80 -
 81
81 -
 82
82 -
 83
83 -
 84
84 -
 85
85 -
 86
86 -
 87
87 -
 88
88 -
89
-
90
-
91
-
92
-
93
-
94
-
95
-
96
 |
 |
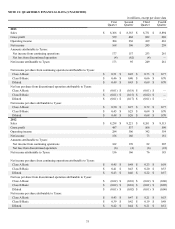
78
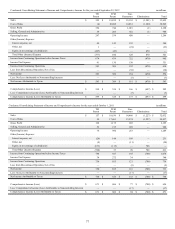
Condensed Consolidating Balance Sheet as of September 28, 2013 in millions
TFI
Parent TFM
Parent Non-
Guarantors Eliminations Total
Assets
Current Assets:
Cash and cash equivalents $ — $ 21 $ 1,124 $ — $ 1,145
Accounts receivable, net — 571 926 — 1,497
Inventories — 1,039 1,778 — 2,817
Other current assets 351 88 117 (411) 145
Total Current Assets 351 1,719 3,945 (411) 5,604
Net Property, Plant and Equipment 32 891 3,130 — 4,053
Goodwill — 881 1,021 — 1,902
Intangible Assets — 21 117 — 138
Other Assets 895 162 244 (821) 480
Investment in Subsidiaries 11,975 2,035 — (14,010) —
Total Assets $ 13,253 $ 5,709 $ 8,457 $ (15,242) $ 12,177
Liabilities and Shareholders’ Equity
Current Liabilities:
Current debt $ 457 $ 132 $ 251 $ (327) $ 513
Accounts payable 27 575 757 — 1,359
Other current liabilities 4,625 200 901 (4,588) 1,138
Total Current Liabilities 5,109 907 1,909 (4,915) 3,010
Long-Term Debt 1,770 679 241 (795) 1,895
Deferred Income Taxes 24 93 362 — 479
Other Liabilities 149 155 282 (26) 560
Total Tyson Shareholders’ Equity 6,201 3,875 5,631 (9,506) 6,201
Noncontrolling Interests ——32—32
Total Shareholders’ Equity 6,201 3,875 5,663 (9,506) 6,233
Total Liabilities and Shareholders’ Equity $ 13,253 $ 5,709 $ 8,457 $ (15,242) $ 12,177