Tyson Foods 2013 Annual Report Download - page 23
Download and view the complete annual report
Please find page 23 of the 2013 Tyson Foods annual report below. You can navigate through the pages in the report by either clicking on the pages listed below, or by using the keyword search tool below to find specific information within the annual report.-
 1
1 -
2
-
3
-
4
-
5
-
6
-
7
-
8
-
9
-
10
-
11
-
12
-
 13
13 -
 14
14 -
 15
15 -
 16
16 -
 17
17 -
 18
18 -
 19
19 -
 20
20 -
 21
21 -
 22
22 -
 23
23 -
 24
24 -
 25
25 -
 26
26 -
 27
27 -
 28
28 -
 29
29 -
 30
30 -
 31
31 -
 32
32 -
 33
33 -
34
-
35
-
36
-
37
-
38
-
39
-
40
-
41
-
42
-
43
-
44
-
45
-
46
-
47
-
48
-
49
-
50
-
51
-
52
-
53
-
54
-
55
-
56
-
57
-
58
-
59
-
60
-
61
-
62
-
63
-
64
-
65
-
66
-
67
-
68
-
69
-
70
-
71
-
72
-
73
-
74
-
75
-
76
-
77
-
78
-
79
-
80
-
81
-
82
-
83
-
84
-
85
-
86
-
87
-
88
-
89
-
90
-
91
-
92
-
93
-
94
-
95
-
96
 |
 |

23
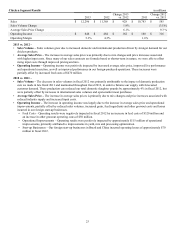
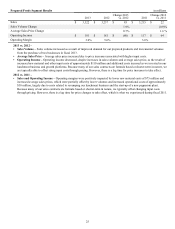
Chicken Segment Results in millions
2013 2012 Change 2013
vs. 2012 2011 Change 2012
vs. 2011
Sales $ 12,296 $ 11,368 $ 928 $ 10,783 $ 585
Sales Volume Change 1.9% (3.5)%
Average Sales Price Change 6.1% 9.3 %
Operating Income $ 646 $ 484 $ 162 $ 168 $ 316
Operating Margin 5.3% 4.3% 1.6%
2013 vs. 2012 –
• Sales Volume – Sales volumes grew due to increased domestic and international production driven by stronger demand for our
chicken products.
• Average Sales Price – The increase in average sales price was primarily due to mix changes and price increases associated
with higher input costs. Since many of our sales contracts are formula based or shorter-term in nature, we were able to offset
rising input costs through improved pricing and mix.
• Operating Income – Operating income was positively impacted by increased average sales price, improved live performance
and operational execution, as well as improved performance in our foreign-produced operations. These increases were
partially offset by increased feed costs of $470 million.
2012 vs. 2011 –
• Sales Volume – The decrease in sales volumes in fiscal 2012 was primarily attributable to the impact of domestic production
cuts we made in late fiscal 2011 and maintained throughout fiscal 2012, in order to balance our supply with forecasted
customer demand. These production cuts reduced our total domestic slaughter pounds by approximately 4% in fiscal 2012, but
were partially offset by increases in international sales volumes and open-market meat purchases.
• Average Sales Price – The increase in average sales prices is primarily due to mix changes and price increases associated with
reduced industry supply and increased input costs.
• Operating Income – The increase in operating income was largely due to the increase in average sales price and operational
improvements, partially offset by reduced sales volumes, increased grain, feed ingredients and other growout costs and losses
incurred in our foreign start-up businesses.
• Feed Costs – Operating results were negatively impacted in fiscal 2012 by an increase in feed costs of $320 million and
an increase in other growout operating costs of $50 million.
• Operational Improvements – Operating results were positively impacted by approximately $115 million of operational
improvements, primarily attributed to improvements in yield, mix and processing optimization.
• Start-up Businesses – Our foreign start-up businesses in Brazil and China incurred operating losses of approximately $70
million in fiscal 2012.