Tyson Foods 2013 Annual Report Download - page 41
Download and view the complete annual report
Please find page 41 of the 2013 Tyson Foods annual report below. You can navigate through the pages in the report by either clicking on the pages listed below, or by using the keyword search tool below to find specific information within the annual report.-
 1
1 -
2
-
3
-
4
-
5
-
6
-
7
-
8
-
9
-
10
-
11
-
12
-
13
-
14
-
15
-
16
-
17
-
18
-
19
-
20
-
21
-
22
-
23
-
24
-
25
-
26
-
27
-
28
-
29
-
30
-
 31
31 -
 32
32 -
 33
33 -
 34
34 -
 35
35 -
 36
36 -
 37
37 -
 38
38 -
 39
39 -
 40
40 -
 41
41 -
 42
42 -
 43
43 -
 44
44 -
 45
45 -
 46
46 -
 47
47 -
 48
48 -
 49
49 -
 50
50 -
 51
51 -
52
-
53
-
54
-
55
-
56
-
57
-
58
-
59
-
60
-
61
-
62
-
63
-
64
-
65
-
66
-
67
-
68
-
69
-
70
-
71
-
72
-
73
-
74
-
75
-
76
-
77
-
78
-
79
-
80
-
81
-
82
-
83
-
84
-
85
-
86
-
87
-
88
-
89
-
90
-
91
-
92
-
93
-
94
-
95
-
96
 |
 |

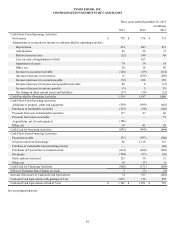
41
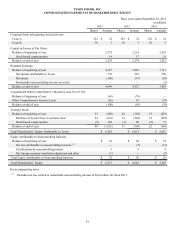
TYSON FOODS, INC.
CONSOLIDATED STATEMENTS OF SHAREHOLDERS’ EQUITY
Three years ended September 28, 2013
in millions
2013 2012 2011
Shares Amount Shares Amount Shares Amount
Common Stock at beginning and end of year:
Class A 322 $ 32 322 $ 32 322 $ 32
Class B 70 7 70 7 70 7
Capital in Excess of Par Value:
Balance at beginning of year 2,278 2,261 2,243
Stock-based compensation 14 17 18
Balance at end of year 2,292 2,278 2,261
Retained Earnings:
Balance at beginning of year 4,327 3,801 3,113
Net income attributable to Tyson 778 583 750
Dividends (106)(57) (59)
Redeemable noncontrolling interest accretion — — (3)
Balance at end of year 4,999 4,327 3,801
Accumulated Other Comprehensive Income (Loss), Net of Tax:
Balance at beginning of year (63)(79) —
Other Comprehensive Income (Loss) (45) 16 (79)
Balance at end of year (108)(63) (79)
Treasury Stock:
Balance at beginning of year 33 (569) 22 (365) 15 (229)
Purchase of Tyson Class A common stock 24 (614) 14 (264) 12 (207)
Stock-based compensation (9) 162 (3) 60 (5) 71
Balance at end of year 48 (1,021) 33 (569) 22 (365)
Total Shareholders’ Equity Attributable to Tyson $ 6,201 $ 6,012 $ 5,657
Equity Attributable to Noncontrolling Interests
Balance at beginning of year $ 30 $ 28 $ 35
Net loss attributable to noncontrolling interests (1) —(7) (13)
Contributions by noncontrolling interest 3 9 8
Net foreign currency translation adjustment and other (1) — (2)
Total Equity Attributable to Noncontrolling Interests $ 32 $ 30 $ 28
Total Shareholders’ Equity $ 6,233 $ 6,042 $ 5,685
See accompanying notes.
(1) Excludes net loss related to redeemable noncontrolling interest of $(4) million for fiscal 2011.