Tyson Foods 2013 Annual Report Download - page 21
Download and view the complete annual report
Please find page 21 of the 2013 Tyson Foods annual report below. You can navigate through the pages in the report by either clicking on the pages listed below, or by using the keyword search tool below to find specific information within the annual report.-
 1
1 -
2
-
3
-
4
-
5
-
6
-
7
-
8
-
9
-
10
-
 11
11 -
 12
12 -
 13
13 -
 14
14 -
 15
15 -
 16
16 -
 17
17 -
 18
18 -
 19
19 -
 20
20 -
 21
21 -
 22
22 -
 23
23 -
 24
24 -
 25
25 -
 26
26 -
 27
27 -
 28
28 -
 29
29 -
 30
30 -
 31
31 -
32
-
33
-
34
-
35
-
36
-
37
-
38
-
39
-
40
-
41
-
42
-
43
-
44
-
45
-
46
-
47
-
48
-
49
-
50
-
51
-
52
-
53
-
54
-
55
-
56
-
57
-
58
-
59
-
60
-
61
-
62
-
63
-
64
-
65
-
66
-
67
-
68
-
69
-
70
-
71
-
72
-
73
-
74
-
75
-
76
-
77
-
78
-
79
-
80
-
81
-
82
-
83
-
84
-
85
-
86
-
87
-
88
-
89
-
90
-
91
-
92
-
93
-
94
-
95
-
96
 |
 |

21
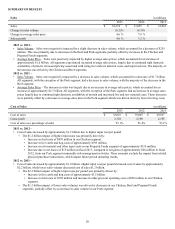
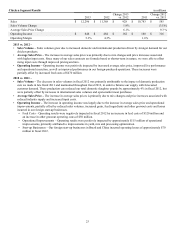
Selling, General and Administrative in millions
2013 2012 2011
Selling, general and administrative $ 983 $ 904 $ 906
As a percentage of sales 2.9% 2.7% 2.8%
2013 vs. 2012 –
• Increase of $79 million in selling, general and administrative is primarily driven by:
• Increase of $44 million related to employee costs including payroll and stock-based and incentive-based
compensation.
• Increase of $32 million related to advertising and sales promotions.
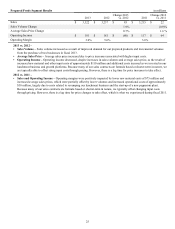
Interest Income in millions
2013 2012 2011
$(7) $ (12) $ (11)
2013/2012/2011 – Interest income remained relatively flat due to continued low interest rates.
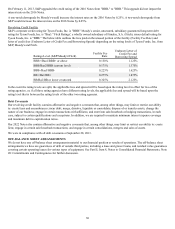
Interest Expense in millions
2013 2012 2011
Cash interest expense $ 117 $ 151 $ 195
Loss on early extinguishment of debt — 167 —
Losses on notes repurchased — — 7
Non-cash interest expense 28 38 40
Total Interest Expense $ 145 $ 356 $ 242
2013/2012/2011 –
• Cash interest expense included interest expense related to the coupon rates for senior notes and commitment/letter of credit
fees incurred on our revolving credit facilities. The decrease in cash interest expense in fiscal 2013 is due to lower average
coupon rates compared to fiscal 2012 and 2011. This decrease is driven by the full extinguishment of the 10.50% Senior Notes
due 2014 (2014 Notes) in fiscal 2012, partially offset with the 4.5% Senior Notes due 2022 (2022 Notes) issued in fiscal 2012.
• Loss on early extinguishment of debt included the amount paid exceeding the par value of debt, unamortized discount and
unamortized debt issuance costs related to the full extinguishment of the 2014 Notes.
• Losses on notes repurchased during fiscal 2011 included the amount paid exceeding the carrying value of the notes
repurchased, which primarily included the repurchases of the 8.25% Notes due October 2011 (2011 Notes) and the 6.60%
Senior Notes due April 2016 (2016 Notes).
• Non-cash interest expense primarily included interest related to the amortization of debt issuance costs and discounts/
premiums on note issuances. This includes debt issuance costs incurred on our revolving credit facility, the 2014 Notes and
the accretion of the debt discount on the 3.25% Convertible Senior Notes due 2013 (2013 Notes).
Other (Income) Expense, net in millions
2013 2012 2011
$(20) $ (23) $ (20)
2013 – Included $19 million related to recognized currency translation adjustment gain.
2012 – Included $16 million of equity earnings in joint ventures and $4 million in net foreign currency exchange gains.
2011 – Included $11 million gain related to a sale of interests in an equity method investment.