Tyson Foods 2013 Annual Report Download - page 25
Download and view the complete annual report
Please find page 25 of the 2013 Tyson Foods annual report below. You can navigate through the pages in the report by either clicking on the pages listed below, or by using the keyword search tool below to find specific information within the annual report.-
 1
1 -
2
-
3
-
4
-
5
-
6
-
7
-
8
-
9
-
10
-
11
-
12
-
13
-
14
-
 15
15 -
 16
16 -
 17
17 -
 18
18 -
 19
19 -
 20
20 -
 21
21 -
 22
22 -
 23
23 -
 24
24 -
 25
25 -
 26
26 -
 27
27 -
 28
28 -
 29
29 -
 30
30 -
 31
31 -
 32
32 -
 33
33 -
 34
34 -
 35
35 -
36
-
37
-
38
-
39
-
40
-
41
-
42
-
43
-
44
-
45
-
46
-
47
-
48
-
49
-
50
-
51
-
52
-
53
-
54
-
55
-
56
-
57
-
58
-
59
-
60
-
61
-
62
-
63
-
64
-
65
-
66
-
67
-
68
-
69
-
70
-
71
-
72
-
73
-
74
-
75
-
76
-
77
-
78
-
79
-
80
-
81
-
82
-
83
-
84
-
85
-
86
-
87
-
88
-
89
-
90
-
91
-
92
-
93
-
94
-
95
-
96
 |
 |

25
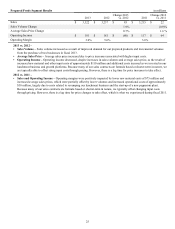
Prepared Foods Segment Results in millions
2013 2012 Change 2013
vs. 2012 2011 Change 2012
vs. 2011
Sales $ 3,322 $ 3,237 $ 85 $ 3,215 $ 22
Sales Volume Change 1.9% (0.9)%
Average Sales Price Change 0.7% 1.6 %
Operating Income $ 101 $ 181 $ (80) $ 117 $ 64
Operating Margin 3.0% 5.6% 3.6%
2013 vs. 2012 –
• Sales Volume – Sales volume increased as a result of improved demand for our prepared products and incremental volumes
from the purchase of two businesses in fiscal 2013.
• Average Sales Price – Average sales price increased due to price increases associated with higher input costs.
• Operating Income – Operating income decreased, despite increases in sales volumes and average sales price, as the result of
increased raw material and other input costs of approximately $110 million and additional costs incurred as we invested in our
lunchmeat business and growth platforms. Because many of our sales contracts are formula based or shorter-term in nature, we
are typically able to offset rising input costs through pricing. However, there is a lag time for price increases to take effect.
2012 vs. 2011 –
• Sales and Operating Income – Operating margins were positively impacted by lower raw material costs of $75 million and
increased average sales prices, which were partially offset by lower volumes and increased operational costs of approximately
$30 million, largely due to costs related to revamping our lunchmeat business and the start-up of a new pepperoni plant.
Because many of our sales contracts are formula based or shorter-term in nature, we typically offset changing input costs
through pricing. However, there is a lag time for price changes to take effect, which is what we experienced during fiscal 2011.