Tyson Foods 2013 Annual Report Download - page 70
Download and view the complete annual report
Please find page 70 of the 2013 Tyson Foods annual report below. You can navigate through the pages in the report by either clicking on the pages listed below, or by using the keyword search tool below to find specific information within the annual report.-
 1
1 -
2
-
3
-
4
-
5
-
6
-
7
-
8
-
9
-
10
-
11
-
12
-
13
-
14
-
15
-
16
-
17
-
18
-
19
-
20
-
21
-
22
-
23
-
24
-
25
-
26
-
27
-
28
-
29
-
30
-
31
-
32
-
33
-
34
-
35
-
36
-
37
-
38
-
39
-
40
-
41
-
42
-
43
-
44
-
45
-
46
-
47
-
48
-
49
-
50
-
51
-
52
-
53
-
54
-
55
-
56
-
57
-
58
-
59
-
 60
60 -
 61
61 -
 62
62 -
 63
63 -
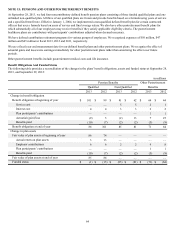 64
64 -
 65
65 -
 66
66 -
 67
67 -
 68
68 -
 69
69 -
 70
70 -
 71
71 -
 72
72 -
 73
73 -
 74
74 -
 75
75 -
 76
76 -
 77
77 -
 78
78 -
 79
79 -
 80
80 -
81
-
82
-
83
-
84
-
85
-
86
-
87
-
88
-
89
-
90
-
91
-
92
-
93
-
94
-
95
-
96
 |
 |

70
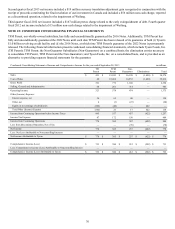
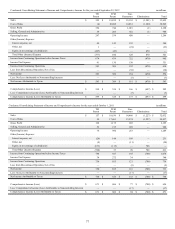
in millions
Chicken Beef Pork Prepared
Foods Other Intersegment
Sales Consolidated
Fiscal year ended September 28, 2013
Sales $ 12,296 $ 14,400 $ 5,408 $ 3,322 $ 46 $ (1,098) $ 34,374
Operating Income 646 296 332 101 — 1,375
Total Other (Income) Expense 118
Income from Continuing Operations before
Income Taxes 1,257
Depreciation 291 87 30 61 5 474
Total Assets 5,820 2,798 931 1,176 1,452 12,177
Additions to property, plant and equipment 311 105 22 87 33 558
Fiscal year ended September 29, 2012
Sales $ 11,368 $ 13,755 $ 5,510 $ 3,237 $ 167 $ (982) $ 33,055
Operating Income (Loss) 484 218 417 181 (14) 1,286
Total Other (Income) Expense 321
Income from Continuing Operations before
Income Taxes 965
Depreciation 268 86 30 54 5 443
Total Assets 5,902 2,634 895 960 1,505 11,896
Additions to property, plant and equipment 451 100 32 99 8 690
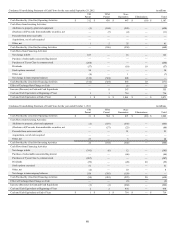
Fiscal year ended October 1, 2011
Sales $ 10,783 $ 13,549 $ 5,460 $ 3,215 $ 127 $ (1,102) $ 32,032
Operating Income (Loss) 168 468 560 117 (24) 1,289
Total Other (Income) Expense 211
Income from Continuing Operations before
Income Taxes 1,078
Depreciation 259 84 28 58 4 433
Total Assets 5,412 2,610 960 943 1,146 11,071
Additions to property, plant and equipment 464 88 27 58 6 643
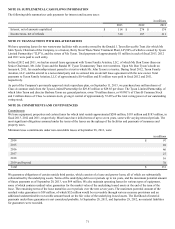
We allocate expenses related to corporate activities to the segments, while the related assets and additions to property, plant and
equipment remain in Other.
The Pork segment had sales of $872 million, $771 million and $816 million for fiscal 2013, 2012 and 2011, respectively, from
transactions with other operating segments. The Beef segment had sales of $226 million, $211 million and $286 million for fiscal
2013, 2012 and 2011, respectively, from transactions with other operating segments.
Our largest customer, Wal-Mart Stores, Inc., accounted for 13.0%, 13.8% and 13.3% of consolidated sales in fiscal 2013, 2012 and
2011, respectively. Sales to Wal-Mart Stores, Inc. were included in the Chicken, Beef, Pork and Prepared Foods segments. Any
extended discontinuance of sales to this customer could, if not replaced, have a material impact on our operations.
The majority of our operations are domiciled in the United States. Approximately 96%, 95% and 96% of sales to external customers
for fiscal 2013, 2012 and 2011, respectively, were sourced from the United States. Approximately $6.1 billion and $5.9 billion of long-
lived assets were located in the United States at September 28, 2013, and September 29, 2012, respectively. Approximately $485
million and $564 million of long-lived assets were located in foreign countries, primarily Brazil, China, Mexico and India, at
September 28, 2013, and September 29, 2012, respectively.
We sell certain products in foreign markets, primarily Brazil, Canada, Central America, China, the European Union, Japan, Mexico,
the Middle East, South Korea, Taiwan, and Vietnam. Our export sales from the United States totaled $4.2 billion, $4.0 billion and $4.1
billion for fiscal 2013, 2012 and 2011, respectively. Substantially all of our export sales are facilitated through unaffiliated brokers,
marketing associations and foreign sales staffs. Sales of products produced in a country other than the United States were less than
10% of consolidated sales for each of fiscal 2013, 2012 and 2011.