Tyson Foods 2013 Annual Report Download - page 22
Download and view the complete annual report
Please find page 22 of the 2013 Tyson Foods annual report below. You can navigate through the pages in the report by either clicking on the pages listed below, or by using the keyword search tool below to find specific information within the annual report.-
 1
1 -
2
-
3
-
4
-
5
-
6
-
7
-
8
-
9
-
10
-
11
-
 12
12 -
 13
13 -
 14
14 -
 15
15 -
 16
16 -
 17
17 -
 18
18 -
 19
19 -
 20
20 -
 21
21 -
 22
22 -
 23
23 -
 24
24 -
 25
25 -
 26
26 -
 27
27 -
 28
28 -
 29
29 -
 30
30 -
 31
31 -
 32
32 -
33
-
34
-
35
-
36
-
37
-
38
-
39
-
40
-
41
-
42
-
43
-
44
-
45
-
46
-
47
-
48
-
49
-
50
-
51
-
52
-
53
-
54
-
55
-
56
-
57
-
58
-
59
-
60
-
61
-
62
-
63
-
64
-
65
-
66
-
67
-
68
-
69
-
70
-
71
-
72
-
73
-
74
-
75
-
76
-
77
-
78
-
79
-
80
-
81
-
82
-
83
-
84
-
85
-
86
-
87
-
88
-
89
-
90
-
91
-
92
-
93
-
94
-
95
-
96
 |
 |

22
Effective Tax Rate
2013 2012 2011
32.6% 36.4% 31.6%
The effective tax rate on continuing operations was impacted by a number of items which result in a difference between our effective
tax rate and the U.S. statutory rate of 35%. The table below reflects significant items impacting the rate as indicated.
2013 –
• Domestic production activity deduction reduced the rate 3.2%.
• General business credits reduced the rate 1.3%.
• State income taxes increased the rate 2.4%.
2012 –
• Domestic production activity deduction reduced the rate 1.8%.
• General business credits reduced the rate 0.7%.
• State income taxes increased the rate 1.5%.
• Foreign rate differences and valuation allowances increased the rate 1.8%.
2011 –
• Domestic production activity deduction reduced the rate 2.3%.
• General business credits reduced the rate 0.9%.
• State income taxes increased the rate 1.6%.
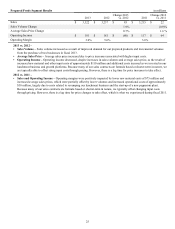
SEGMENT RESULTS
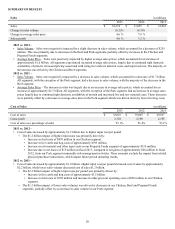
We operate in four segments: Chicken, Beef, Pork and Prepared Foods. The following table is a summary of sales and operating
income (loss), which is how we measure segment income (loss).
in millions
Sales Operating Income (Loss)
2013 2012 2011 2013 2012 2011
Chicken $ 12,296 $ 11,368 $ 10,783 $ 646 $ 484 $ 168
Beef 14,400 13,755 13,549 296 218 468
Pork 5,408 5,510 5,460 332 417 560
Prepared Foods 3,322 3,237 3,215 101 181 117
Other 46 167 127 — (14) (24)
Intersegment Sales (1,098) (982)(1,102) — — —
Total $ 34,374 $ 33,055 $ 32,032 $ 1,375 $ 1,286 $ 1,289