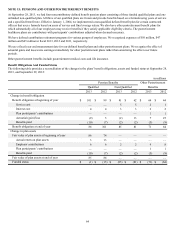
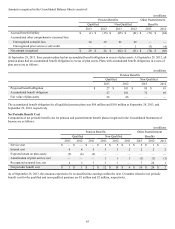
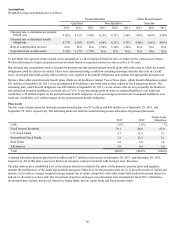
Tyson Foods 2013 Annual Report Download - page 67
Download and view the complete annual report
Please find page 67 of the 2013 Tyson Foods annual report below. You can navigate through the pages in the report by either clicking on the pages listed below, or by using the keyword search tool below to find specific information within the annual report.-
 1
1 -
2
-
3
-
4
-
5
-
6
-
7
-
8
-
9
-
10
-
11
-
12
-
13
-
14
-
15
-
16
-
17
-
18
-
19
-
20
-
21
-
22
-
23
-
24
-
25
-
26
-
27
-
28
-
29
-
30
-
31
-
32
-
33
-
34
-
35
-
36
-
37
-
38
-
39
-
40
-
41
-
42
-
43
-
44
-
45
-
46
-
47
-
48
-
49
-
50
-
51
-
52
-
53
-
54
-
55
-
56
-
 57
57 -
 58
58 -
 59
59 -
 60
60 -
 61
61 -
 62
62 -
 63
63 -
 64
64 -
 65
65 -
 66
66 -
 67
67 -
 68
68 -
 69
69 -
 70
70 -
 71
71 -
 72
72 -
 73
73 -
 74
74 -
 75
75 -
 76
76 -
 77
77 -
78
-
79
-
80
-
81
-
82
-
83
-
84
-
85
-
86
-
87
-
88
-
89
-
90
-
91
-
92
-
93
-
94
-
95
-
96
 |
 |

67
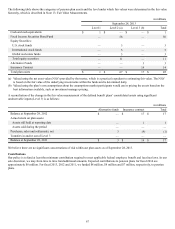
The following table shows the categories of pension plan assets and the level under which fair values were determined in the fair value
hierarchy, which is described in Note 13: Fair Value Measurements.
in millions
September 28, 2013
Level 1 Level 2 (a) Level 3 (b) Total
Cash and cash equivalents $ 1 $ — $ — $ 1
Fixed Income Securities Bond Fund — 56 — 56
Equity Securities:
U.S. stock funds — 3 — 3
International stock funds — 5 — 5
Global real estate funds — 3 — 3
Total equity securities — 11 — 11
Alternative Funds — — 3 3
Insurance Contract — — 14 14
Total plan assets $ 1 $ 67 $ 17 $ 85
(a) Valued using the net asset value (NAV) provided by the trustee, which is a practical expedient to estimating fair value. The NAV
is based on the fair value of the underlying investments within the funds and is determined daily.
(b) Valued using the plan’s own assumptions about the assumptions market participants would use in pricing the assets based on the
best information available, such as investment manager pricing.
A reconciliation of the change in the fair value measurement of the defined benefit plans’ consolidated assets using significant
unobservable inputs (Level 3) is as follows:
in millions
Alternative funds Insurance contract Total
Balance at September 29, 2012 $ — $ 17 $ 17
Actual return on plan assets:
Assets still held at reporting date — 1 1
Assets sold during the period — — —
Purchases, sales and settlements, net 3(4) (1)
Transfers in and/or out of Level 3 — — —
Balance at September 28, 2013 $ 3 $ 14 $ 17
We believe there are no significant concentrations of risk within our plan assets as of September 28, 2013.
Contributions
Our policy is to fund at least the minimum contribution required to meet applicable federal employee benefit and local tax laws. In our
sole discretion, we may from time to time fund additional amounts. Expected contributions to pension plans for fiscal 2014 are
approximately $8 million. For fiscal 2013, 2012 and 2011, we funded $8 million, $8 million and $7 million, respectively, to pension
plans.