TripAdvisor 2013 Annual Report Download - page 99
Download and view the complete annual report
Please find page 99 of the 2013 TripAdvisor annual report below. You can navigate through the pages in the report by either clicking on the pages listed below, or by using the keyword search tool below to find specific information within the annual report.-
 1
1 -
2
-
3
-
4
-
5
-
6
-
7
-
8
-
9
-
10
-
11
-
12
-
13
-
14
-
15
-
16
-
17
-
18
-
19
-
20
-
21
-
22
-
23
-
24
-
25
-
26
-
27
-
28
-
29
-
30
-
31
-
32
-
33
-
34
-
35
-
36
-
37
-
38
-
39
-
40
-
41
-
42
-
43
-
44
-
45
-
46
-
47
-
48
-
49
-
50
-
51
-
52
-
53
-
54
-
55
-
56
-
57
-
58
-
59
-
60
-
61
-
62
-
63
-
64
-
65
-
66
-
67
-
68
-
69
-
70
-
71
-
72
-
73
-
74
-
75
-
76
-
77
-
78
-
79
-
80
-
81
-
82
-
83
-
84
-
85
-
86
-
87
-
88
-
 89
89 -
 90
90 -
 91
91 -
 92
92 -
 93
93 -
 94
94 -
 95
95 -
 96
96 -
 97
97 -
 98
98 -
 99
99 -
 100
100 -
 101
101 -
 102
102 -
 103
103 -
 104
104 -
 105
105 -
 106
106 -
 107
107 -
 108
108 -
 109
109 -
110
-
111
-
112
-
113
-
114
-
115
-
116
-
117
-
118
-
119
-
120
-
121
-
122
-
123
-
124
-
125
-
126
-
127
-
128
-
129
-
130
-
131
-
132
-
133
-
134
-
135
-
136
-
137
-
138
-
139
-
140
-
141
-
142
-
143
-
144
-
145
-
146
-
147
-
148
-
149
-
150
-
151
-
152
-
153
-
154
-
155
-
156
-
157
-
158
-
159
-
160
-
161
-
162
-
163
-
164
-
165
-
166
-
167
-
168
-
169
-
170
-
171
-
172
-
173
-
174
-
175
-
176
-
177
-
178
-
179
-
180
-
181
-
182
-
183
-
184
 |
 |

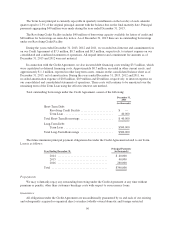
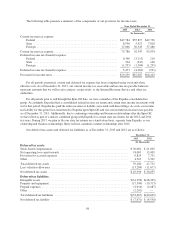
A summary of the status and activity for stock option awards relating to our common stock for the year
ended December 31, 2013, is presented below:
Options
Outstanding
Weighted
Average
Exercise
Price Per
Share
Weighted
Average
Remaining
Contractual
Life
Aggregate
Intrinsic
Value
(In thousands) (In years) (In thousands)
Options outstanding at January 1, 2013 ................ 8,654 $31.41
Granted ......................................... 2,825 58.03
Exercised (1) ..................................... 1,487 23.81
Cancelled or expired ............................... 522 38.09
Options outstanding at December 31, 2013 ............. 9,470 $40.18 5.9 $403,828
Exercisable as of December 31, 2013 .................. 3,533 $30.11 3.0 $186,273
Vested and expected to vest after December 31, 2013 ..... 8,731 $39.94 5.7 $374,487
(1) Inclusive of 242,767 options which were not converted into shares due to net share settlement in order to
cover the aggregate exercise price and the minimum amount of required employee withholding taxes.
Potential shares which had been convertible under stock options that were withheld under net share
settlement remain in the authorized but unissued pool under the 2011 Incentive Plan and can be reissued by
the Company. We began net-share settling the majority of our stock option exercises during the third quarter
of 2013. Total payments for the employees’ tax obligations to the taxing authorities due to net share
settlements are reflected as a financing activity within the consolidated statements of cash flows.
Aggregate intrinsic value represents the difference between the closing stock price of our common stock and
the exercise price of outstanding, in-the-money options. Our closing stock price as reported on NASDAQ as of
December 31, 2013 was $82.83. The total intrinsic value of stock options exercised for the years ended
December 31, 2013 and 2012 were $58.2 million and $25.1 million, respectively. No stock options were
exercised between Spin-Off and December 31, 2011.
The fair value of stock option grants under the 2011 Incentive Plan has been estimated at the date of grant
using the Black–Scholes option pricing model with the following weighted average assumptions for the periods
presented:
December 31,
2013 2012
Risk free interest rate .......................... 1.41% 1.03%
Expected term (in years) ........................ 6.06 6.21
Expected volatility ............................. 50.78% 53.46%
Expected dividend yield ........................ — % — %
The weighted-average grant date fair value of options granted was $28.30 and $20.36 for the years ended
December 31, 2013 and 2012, respectively. No stock options were granted under the 2011 Incentive Plan for the
year ended December 31, 2011. The total fair value of stock options vested for the years ended December 31,
2013 and 2012 were $26.6 million and $9.8 million, respectively. No stock options were vested between
Spin-Off and December 31, 2011.
2013 RSU Activity
During the year ended December 31, 2013, we issued 1,148,976 RSUs under the 2011 Incentive Plan for
which the fair value was measured based on the quoted price of our common stock. These RSUs generally vest
over a four-year requisite service period. We will amortize the fair value of the 2013 grants, net of estimated
89