TripAdvisor 2013 Annual Report Download - page 97
Download and view the complete annual report
Please find page 97 of the 2013 TripAdvisor annual report below. You can navigate through the pages in the report by either clicking on the pages listed below, or by using the keyword search tool below to find specific information within the annual report.-
 1
1 -
2
-
3
-
4
-
5
-
6
-
7
-
8
-
9
-
10
-
11
-
12
-
13
-
14
-
15
-
16
-
17
-
18
-
19
-
20
-
21
-
22
-
23
-
24
-
25
-
26
-
27
-
28
-
29
-
30
-
31
-
32
-
33
-
34
-
35
-
36
-
37
-
38
-
39
-
40
-
41
-
42
-
43
-
44
-
45
-
46
-
47
-
48
-
49
-
50
-
51
-
52
-
53
-
54
-
55
-
56
-
57
-
58
-
59
-
60
-
61
-
62
-
63
-
64
-
65
-
66
-
67
-
68
-
69
-
70
-
71
-
72
-
73
-
74
-
75
-
76
-
77
-
78
-
79
-
80
-
81
-
82
-
83
-
84
-
85
-
86
-
 87
87 -
 88
88 -
 89
89 -
 90
90 -
 91
91 -
 92
92 -
 93
93 -
 94
94 -
 95
95 -
 96
96 -
 97
97 -
 98
98 -
 99
99 -
 100
100 -
 101
101 -
 102
102 -
 103
103 -
 104
104 -
 105
105 -
 106
106 -
 107
107 -
108
-
109
-
110
-
111
-
112
-
113
-
114
-
115
-
116
-
117
-
118
-
119
-
120
-
121
-
122
-
123
-
124
-
125
-
126
-
127
-
128
-
129
-
130
-
131
-
132
-
133
-
134
-
135
-
136
-
137
-
138
-
139
-
140
-
141
-
142
-
143
-
144
-
145
-
146
-
147
-
148
-
149
-
150
-
151
-
152
-
153
-
154
-
155
-
156
-
157
-
158
-
159
-
160
-
161
-
162
-
163
-
164
-
165
-
166
-
167
-
168
-
169
-
170
-
171
-
172
-
173
-
174
-
175
-
176
-
177
-
178
-
179
-
180
-
181
-
182
-
183
-
184
 |
 |

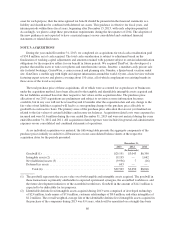
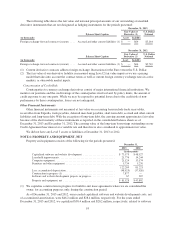
over their estimated useful lives from acquisition date. The overall weighted average life of acquired
intangible assets during 2011 was 2.8 years.
(3) Includes cash acquired of $2.9 million, $0 million and $0.1 million during 2013, 2012 and 2011,
respectively.
(4) Subject to adjustment based on (i) final working capital adjustment calculations to be determined, and
(ii) indemnification obligations of the acquired company stockholders that remains to be paid of
$1.8 million at December 31, 2013.
Our consolidated and combined financial statements include the operating results of all acquired businesses
from the date of each acquisition. We did not have any material acquisitions, individually or in the aggregate,
during the years 2013, 2012 and 2011; therefore no pro-forma results have been provided.
Other Acquisition Activity
During 2012 we also paid $22.3 million for the remaining noncontrolling interest subsidiary shares related
to a 2008 acquisition, which brought our ownership to 100%. This amount is included in financing activities in
the consolidated statement of cash flows for 2012.
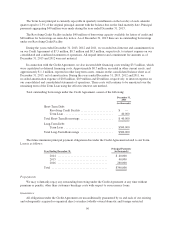
During 2011, we paid $13 million of contingent purchase consideration under prior acquisitions. The
amount in 2011 represented an earn-out payment, of which approximately $10 million and $3 million are
recorded to financing activities and operating activities, respectively, in the consolidated and combined statement
of cash flows. All contingent consideration accrued and paid was calculated based on the financial performance
of the acquired entity to which it relates. We also purchased a subsidiary in China from Expedia for $37 million,
or $28 million net of acquired cash. This acquisition was accounted for as a common control transaction, with net
liabilities recorded at a carrying value of $4 million, including an additional $7 million of short term borrowings
from the Chinese Credit Facilities (refer to “Note 8—Debt” below for further information on the Chinese Credit
Facilities). No goodwill or other intangibles were recorded as a result of this acquisition and no contingent
payments are outstanding. The difference between the purchase price and the carrying value of the net liabilities
was recorded to additional paid in capital. The results of operations from this business are included in our
consolidated and combined financial statements from the transaction closing date.
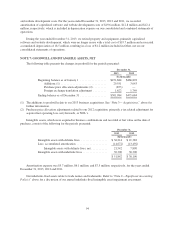
NOTE 4: STOCK BASED AWARDS AND OTHER EQUITY INSTRUMENTS
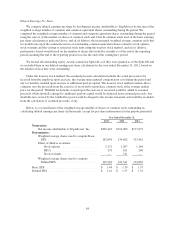
Stock-based Compensation Expense
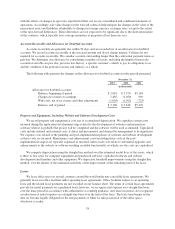
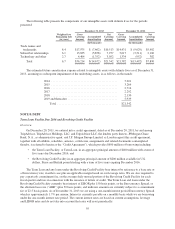
The following table presents the amount of stock-based compensation related to stock-based awards,
primarily stock options and RSUs, on our consolidated and combined statements of operations during the periods
presented:
Year Ended December 31,
2013 2012 2011
(In thousands)
Selling and marketing ................................... $10,643 $ 4,622 $ 3,216
Technology and content .................................. 21,053 11,400 3,931
General and administrative ............................... 17,257 14,080 10,197
Total stock-based compensation ....................... 48,953 30,102 17,344
Income tax benefit from stock-based compensation ............ (18,014) (10,648) (6,504)
Total stock-based compensation, net of tax effect ......... $30,939 $ 19,454 $10,840
The year ended December 31, 2011 includes a one-time modification charge of $8.0 million related to the
Spin-Off, primarily due to the modification of vested stock options that remained unexercised at the date of the
Spin-Off, which the majority of was recorded to general and administrative expense. There were no material
modifications to stock based awards for the years ended December 31, 2013 or 2012, respectively.
87