TripAdvisor 2013 Annual Report Download - page 56
Download and view the complete annual report
Please find page 56 of the 2013 TripAdvisor annual report below. You can navigate through the pages in the report by either clicking on the pages listed below, or by using the keyword search tool below to find specific information within the annual report.-
 1
1 -
2
-
3
-
4
-
5
-
6
-
7
-
8
-
9
-
10
-
11
-
12
-
13
-
14
-
15
-
16
-
17
-
18
-
19
-
20
-
21
-
22
-
23
-
24
-
25
-
26
-
27
-
28
-
29
-
30
-
31
-
32
-
33
-
34
-
35
-
36
-
37
-
38
-
39
-
40
-
41
-
42
-
43
-
44
-
45
-
 46
46 -
 47
47 -
 48
48 -
 49
49 -
 50
50 -
 51
51 -
 52
52 -
 53
53 -
 54
54 -
 55
55 -
 56
56 -
 57
57 -
 58
58 -
 59
59 -
 60
60 -
 61
61 -
 62
62 -
 63
63 -
 64
64 -
 65
65 -
 66
66 -
67
-
68
-
69
-
70
-
71
-
72
-
73
-
74
-
75
-
76
-
77
-
78
-
79
-
80
-
81
-
82
-
83
-
84
-
85
-
86
-
87
-
88
-
89
-
90
-
91
-
92
-
93
-
94
-
95
-
96
-
97
-
98
-
99
-
100
-
101
-
102
-
103
-
104
-
105
-
106
-
107
-
108
-
109
-
110
-
111
-
112
-
113
-
114
-
115
-
116
-
117
-
118
-
119
-
120
-
121
-
122
-
123
-
124
-
125
-
126
-
127
-
128
-
129
-
130
-
131
-
132
-
133
-
134
-
135
-
136
-
137
-
138
-
139
-
140
-
141
-
142
-
143
-
144
-
145
-
146
-
147
-
148
-
149
-
150
-
151
-
152
-
153
-
154
-
155
-
156
-
157
-
158
-
159
-
160
-
161
-
162
-
163
-
164
-
165
-
166
-
167
-
168
-
169
-
170
-
171
-
172
-
173
-
174
-
175
-
176
-
177
-
178
-
179
-
180
-
181
-
182
-
183
-
184
 |
 |

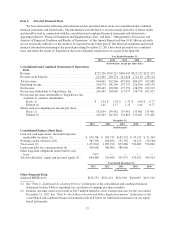
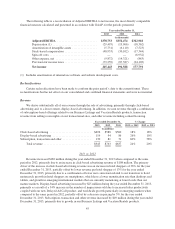
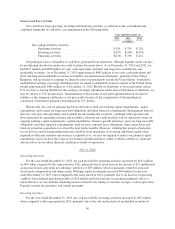
2012 vs. 2011
Revenue increased $126 million during the year ended December 31, 2012 when compared to the same
period in 2011, primarily due to an increase in click-based advertising revenue of $88 million. The primary
driver of the increase in click-based advertising revenue was an increase in hotel shoppers during the year ended
December 31, 2012, when compared to the same period for 2011, of 32%, partially offset by lower revenue per
hotel shopper of 8% for the year ended December 31, 2012, primarily due to lower clicks per hotel shopper due
to our site redesign in September 2011. Display-based advertising increased by $8 million during the year ended
December 31, 2012, primarily as a result of a 6% increase in the number of impressions sold when compared to
the same period in 2011, and an increase in pricing by 1% for the year ended December 31, 2012. Subscription,
transaction and other revenue increased by $30 million during the year ended December 31, 2012, primarily due
to growth in our Business Listings and Vacation Rentals products.
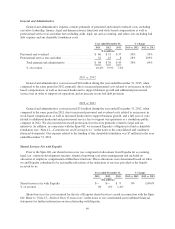
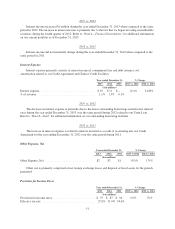
The following table presents our revenue by geographic region, which reflects how we measure our business
internally. Revenue by geography is based on the location of our websites:
Year ended December 31, % Change
2013 2012 2011 2013 vs. 2012 2012 vs. 2011
($ in millions)
North America (1) ................................ $494 $409 $360 21% 13%
EMEA (2) ....................................... 291 240 218 21% 10%
APAC (3) ....................................... 122 82 46 49% 80%
LATAM (4) ..................................... 38 32 13 20% 137%
Total revenue ................................ $945 $763 $637 24% 20%
(1) United States and Canada*
(2) Europe, Middle East and Africa
(3) Asia-Pacific
(4) Latin America
* Included in international revenue for discussion purposes.
International revenue increased $105 million and $88 million during the years ended December 31, 2013
and 2012, respectively, compared to the same periods in 2012 and 2011. International revenue represented 51%,
49%, and 45% of total revenue during the years ended December 31, 2013, 2012, and 2011, respectively. The
increase in international revenue, in absolute dollars and as a percentage of total revenue, is primarily due to
additional investment in international expansion and growth in international hotel shoppers.
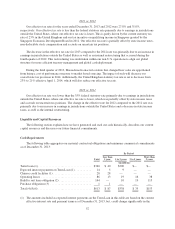
In addition to the above product revenue discussion, Revenue from Expedia, which consists primarily of
click-based advertising, is as follows:
Year ended December 31, % Change
2013 2012 2011 2013 vs. 2012 2012 vs. 2011
($ in millions)
Revenue from Expedia ............................... $217 $204 $211 7% (3)%
% of revenue ...................................... 23.0% 26.7% 33.1%
2013 vs. 2012
Revenue from Expedia increased $13 million during the year ended December 31, 2013, respectively, when
compared to the same period in 2012, primarily due to lower click volume sent to Expedia, primarily related to
our transition to hotel metasearch which was more than offset by higher CPC pricing paid by Expedia during this
time period. For information on our relationship with Expedia refer to “Note 15—Related Party Transactions” in
the notes to our consolidated and combined financial statements.
46