TripAdvisor 2013 Annual Report Download - page 48
Download and view the complete annual report
Please find page 48 of the 2013 TripAdvisor annual report below. You can navigate through the pages in the report by either clicking on the pages listed below, or by using the keyword search tool below to find specific information within the annual report.-
 1
1 -
2
-
3
-
4
-
5
-
6
-
7
-
8
-
9
-
10
-
11
-
12
-
13
-
14
-
15
-
16
-
17
-
18
-
19
-
20
-
21
-
22
-
23
-
24
-
25
-
26
-
27
-
28
-
29
-
30
-
31
-
32
-
33
-
34
-
35
-
36
-
37
-
 38
38 -
 39
39 -
 40
40 -
 41
41 -
 42
42 -
 43
43 -
 44
44 -
 45
45 -
 46
46 -
 47
47 -
 48
48 -
 49
49 -
 50
50 -
 51
51 -
 52
52 -
 53
53 -
 54
54 -
 55
55 -
 56
56 -
 57
57 -
 58
58 -
59
-
60
-
61
-
62
-
63
-
64
-
65
-
66
-
67
-
68
-
69
-
70
-
71
-
72
-
73
-
74
-
75
-
76
-
77
-
78
-
79
-
80
-
81
-
82
-
83
-
84
-
85
-
86
-
87
-
88
-
89
-
90
-
91
-
92
-
93
-
94
-
95
-
96
-
97
-
98
-
99
-
100
-
101
-
102
-
103
-
104
-
105
-
106
-
107
-
108
-
109
-
110
-
111
-
112
-
113
-
114
-
115
-
116
-
117
-
118
-
119
-
120
-
121
-
122
-
123
-
124
-
125
-
126
-
127
-
128
-
129
-
130
-
131
-
132
-
133
-
134
-
135
-
136
-
137
-
138
-
139
-
140
-
141
-
142
-
143
-
144
-
145
-
146
-
147
-
148
-
149
-
150
-
151
-
152
-
153
-
154
-
155
-
156
-
157
-
158
-
159
-
160
-
161
-
162
-
163
-
164
-
165
-
166
-
167
-
168
-
169
-
170
-
171
-
172
-
173
-
174
-
175
-
176
-
177
-
178
-
179
-
180
-
181
-
182
-
183
-
184
 |
 |

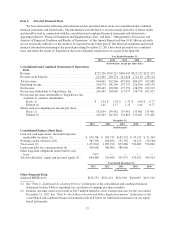
(3) Amount does not include available for sale long-term marketable securities of $188 million and $99 million,
as of December 31, 2013 and 2012, respectively.
(4) See “Note 8—Debt” in the notes to the consolidated and combined financial statements for information
regarding our long-term debt.
(5) See our consolidated and combined statements of changes in stockholders’ equity and
“Note 14—Stockholders’ Equity” in the notes to the consolidated and combined financial statements in
Item 8 below for additional information on changes to our stockholders’ equity and invested capital.
(6) To provide investors with additional information regarding our financial results, we have disclosed Adjusted
EBITDA, a non-GAAP financial measure, within this Annual Report on Form 10-K. Adjusted EBITDA is
the primary metric by which management evaluates the performance of our business and on which internal
budgets are based. We define Adjusted EBITDA as net income (loss) plus: (1) provision for income taxes;
(2) other (income) expense, net; (3) depreciation of property and equipment, including internal use software
and website development; (4) amortization of intangible assets; (5) stock-based compensation; and (6) non-
recurring expenses. Such amounts are detailed below. See a discussion of “Adjusted EBITDA” in Item 7.
“Management’s Discussion and Analysis of Financial Condition and Results of Operations” within this
Annual Report on Form 10-K.
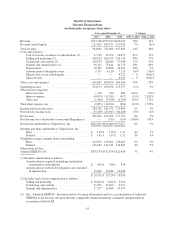
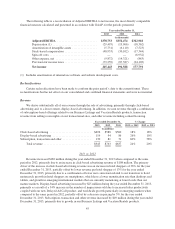
We have provided a reconciliation below of Adjusted EBITDA to net income, the most directly comparable
GAAP financial measure.
Year Ended December 31,
2013 2012 2011 2010 2009
(in thousands)
Adjusted EBITDA ........................... $378,753 $352,474 $322,918 $260,963 $197,219
Depreciation (1) .......................... (29,495) (19,966) (18,362) (12,871) (9,330)
Amortization of intangible assets ............. (5,731) (6,110) (7,523) (14,609) (13,806)
Stock-based compensation .................. (48,953) (30,102) (17,344) (7,183) (5,905)
Spin-Off costs ............................ — — (6,932) — —
Other expense, net ........................ (9,872) (14,321) (863) (1,885) (1,638)
Provision for income taxes .................. (79,259) (87,387) (94,103) (85,461) (64,325)
Net income .................................. $205,443 $194,588 $177,791 $138,954 $102,215
(1) Includes amortization of internal use software and website development costs.
38