TripAdvisor 2013 Annual Report Download - page 45
Download and view the complete annual report
Please find page 45 of the 2013 TripAdvisor annual report below. You can navigate through the pages in the report by either clicking on the pages listed below, or by using the keyword search tool below to find specific information within the annual report.-
 1
1 -
2
-
3
-
4
-
5
-
6
-
7
-
8
-
9
-
10
-
11
-
12
-
13
-
14
-
15
-
16
-
17
-
18
-
19
-
20
-
21
-
22
-
23
-
24
-
25
-
26
-
27
-
28
-
29
-
30
-
31
-
32
-
33
-
34
-
 35
35 -
 36
36 -
 37
37 -
 38
38 -
 39
39 -
 40
40 -
 41
41 -
 42
42 -
 43
43 -
 44
44 -
 45
45 -
 46
46 -
 47
47 -
 48
48 -
 49
49 -
 50
50 -
 51
51 -
 52
52 -
 53
53 -
 54
54 -
 55
55 -
56
-
57
-
58
-
59
-
60
-
61
-
62
-
63
-
64
-
65
-
66
-
67
-
68
-
69
-
70
-
71
-
72
-
73
-
74
-
75
-
76
-
77
-
78
-
79
-
80
-
81
-
82
-
83
-
84
-
85
-
86
-
87
-
88
-
89
-
90
-
91
-
92
-
93
-
94
-
95
-
96
-
97
-
98
-
99
-
100
-
101
-
102
-
103
-
104
-
105
-
106
-
107
-
108
-
109
-
110
-
111
-
112
-
113
-
114
-
115
-
116
-
117
-
118
-
119
-
120
-
121
-
122
-
123
-
124
-
125
-
126
-
127
-
128
-
129
-
130
-
131
-
132
-
133
-
134
-
135
-
136
-
137
-
138
-
139
-
140
-
141
-
142
-
143
-
144
-
145
-
146
-
147
-
148
-
149
-
150
-
151
-
152
-
153
-
154
-
155
-
156
-
157
-
158
-
159
-
160
-
161
-
162
-
163
-
164
-
165
-
166
-
167
-
168
-
169
-
170
-
171
-
172
-
173
-
174
-
175
-
176
-
177
-
178
-
179
-
180
-
181
-
182
-
183
-
184
 |
 |
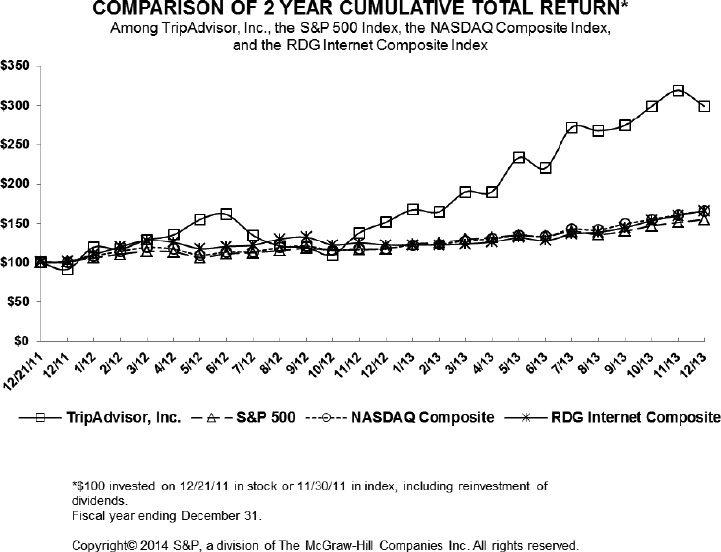
Performance Comparison Graph
The following graph provides a comparison of the total stockholder return from December 21, 2011 to
December 31, 2013 of an investment of $100 in cash on December 21, 2011 for TripAdvisor, Inc. common stock
and an investment of $100 in cash on November 30, 2011 for (i) the Standard and Poor’s 500 Index (the “S&P
500 Index”), (ii) the NASDAQ Composite Index, , and (iii) the Research Data Group (“RDG”) Internet
Composite Index. The RDG Internet Composite Index is an index of stocks representing the Internet industry,
including Internet software and service companies and e-commerce companies. The stock price performance
shown on the graph below is not necessarily indicative of future price performance. Data for the S&P 500 Index,
the NASDAQ Composite Index, and the RDG Internet Composite Index assume reinvestment of dividends. We
have never paid dividends on our common stock.
This performance comparison graph is not “soliciting material,” is not deemed filed with the Securities and
Exchange Commission and is not deemed to be incorporated by reference by any general statement
incorporating by reference this Annual Report on Form 10-K into any filing of TripAdvisor, Inc. under the
Securities Act of 1933, as amended (the “Securities Act”), or any filing under the Securities Exchange Act of
1934, as amended (the “Exchange Act”), except to the extent that we specifically request that the information be
treated as soliciting material or specifically incorporate this information by reference into any such filing, and
will not otherwise be deemed incorporated by reference into any other filing under the Securities Act or the
Exchange Act, except to the extent that we specifically incorporate it by reference.
Holders of Record
As of February 6, 2014, there were 129,432,796 outstanding shares of our common stock held by 3,150
stockholders of record, and 12,799,999 outstanding shares of our Class B common stock held by one stockholder
of record: Liberty.
35