TripAdvisor 2013 Annual Report Download - page 61
Download and view the complete annual report
Please find page 61 of the 2013 TripAdvisor annual report below. You can navigate through the pages in the report by either clicking on the pages listed below, or by using the keyword search tool below to find specific information within the annual report.-
 1
1 -
2
-
3
-
4
-
5
-
6
-
7
-
8
-
9
-
10
-
11
-
12
-
13
-
14
-
15
-
16
-
17
-
18
-
19
-
20
-
21
-
22
-
23
-
24
-
25
-
26
-
27
-
28
-
29
-
30
-
31
-
32
-
33
-
34
-
35
-
36
-
37
-
38
-
39
-
40
-
41
-
42
-
43
-
44
-
45
-
46
-
47
-
48
-
49
-
50
-
 51
51 -
 52
52 -
 53
53 -
 54
54 -
 55
55 -
 56
56 -
 57
57 -
 58
58 -
 59
59 -
 60
60 -
 61
61 -
 62
62 -
 63
63 -
 64
64 -
 65
65 -
 66
66 -
 67
67 -
 68
68 -
 69
69 -
 70
70 -
 71
71 -
72
-
73
-
74
-
75
-
76
-
77
-
78
-
79
-
80
-
81
-
82
-
83
-
84
-
85
-
86
-
87
-
88
-
89
-
90
-
91
-
92
-
93
-
94
-
95
-
96
-
97
-
98
-
99
-
100
-
101
-
102
-
103
-
104
-
105
-
106
-
107
-
108
-
109
-
110
-
111
-
112
-
113
-
114
-
115
-
116
-
117
-
118
-
119
-
120
-
121
-
122
-
123
-
124
-
125
-
126
-
127
-
128
-
129
-
130
-
131
-
132
-
133
-
134
-
135
-
136
-
137
-
138
-
139
-
140
-
141
-
142
-
143
-
144
-
145
-
146
-
147
-
148
-
149
-
150
-
151
-
152
-
153
-
154
-
155
-
156
-
157
-
158
-
159
-
160
-
161
-
162
-
163
-
164
-
165
-
166
-
167
-
168
-
169
-
170
-
171
-
172
-
173
-
174
-
175
-
176
-
177
-
178
-
179
-
180
-
181
-
182
-
183
-
184
 |
 |

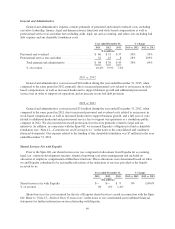
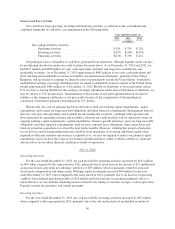
2013 vs. 2012
Interest income increased $1 million during the year ended December 31, 2013 when compared to the same
period in 2012. The increase in interest income is primarily due to the fact that we began investing in marketable
securities during the fourth quarter of 2012. Refer to “Note 4—Financial Instruments” for additional information
on our current portfolio as of December 31, 2013.
2012 vs. 2011
Interest income did not materially change during the year ended December 31, 2012 when compared to the
same period in 2011.
Interest Expense
Interest expense primarily consists of interest incurred, commitment fees and debt issuance cost
amortization related to our Credit Agreement and Chinese Credit Facilities.
Year ended December 31, % Change
2013 2012 2011 2013 vs. 2012 2012 vs. 2011
($ in millions)
Interest expense .................................... $10 $11 $— (11)% 2,629%
% of revenue ....................................... 1.1% 1.5% 0.1%
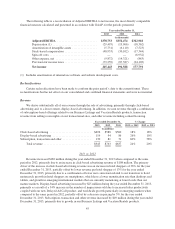
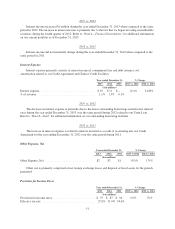
2013 vs. 2012
The decrease in interest expense is primarily due to the lower outstanding borrowings and effective interest
rates during the year ended December 31, 2013 over the same period during 2012 related to our Term Loan.
Refer to “Note 8—Debt” for additional information on our outstanding borrowing facilities.
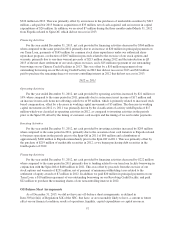
2012 vs. 2011
The increase in interest expense is related to interest incurred as a result of us entering into our Credit
Agreement for the year ending December 31, 2012 over the same period during 2011.
Other Expense, Net
Year ended December 31, % Change
2013 2012 2011 2013 vs 2012 2012 vs 2011
($ in millions)
Other Expense, Net ................................ $2 $3 $1 (55)% 175%
Other, net is primarily comprised of net foreign exchange losses and disposal of fixed assets for the periods
presented.
Provision for Income Taxes
Year ended December 31, % Change
2013 2012 2011 2013 vs. 2012 2012 vs. 2011
($ in millions)
Provision for income taxes ............................ $ 79 $ 87 $ 94 (9)% (7)%
Effective tax rate ................................... 27.8% 31.0% 34.6%
51