TripAdvisor 2013 Annual Report Download - page 47
Download and view the complete annual report
Please find page 47 of the 2013 TripAdvisor annual report below. You can navigate through the pages in the report by either clicking on the pages listed below, or by using the keyword search tool below to find specific information within the annual report.-
 1
1 -
2
-
3
-
4
-
5
-
6
-
7
-
8
-
9
-
10
-
11
-
12
-
13
-
14
-
15
-
16
-
17
-
18
-
19
-
20
-
21
-
22
-
23
-
24
-
25
-
26
-
27
-
28
-
29
-
30
-
31
-
32
-
33
-
34
-
35
-
36
-
 37
37 -
 38
38 -
 39
39 -
 40
40 -
 41
41 -
 42
42 -
 43
43 -
 44
44 -
 45
45 -
 46
46 -
 47
47 -
 48
48 -
 49
49 -
 50
50 -
 51
51 -
 52
52 -
 53
53 -
 54
54 -
 55
55 -
 56
56 -
 57
57 -
58
-
59
-
60
-
61
-
62
-
63
-
64
-
65
-
66
-
67
-
68
-
69
-
70
-
71
-
72
-
73
-
74
-
75
-
76
-
77
-
78
-
79
-
80
-
81
-
82
-
83
-
84
-
85
-
86
-
87
-
88
-
89
-
90
-
91
-
92
-
93
-
94
-
95
-
96
-
97
-
98
-
99
-
100
-
101
-
102
-
103
-
104
-
105
-
106
-
107
-
108
-
109
-
110
-
111
-
112
-
113
-
114
-
115
-
116
-
117
-
118
-
119
-
120
-
121
-
122
-
123
-
124
-
125
-
126
-
127
-
128
-
129
-
130
-
131
-
132
-
133
-
134
-
135
-
136
-
137
-
138
-
139
-
140
-
141
-
142
-
143
-
144
-
145
-
146
-
147
-
148
-
149
-
150
-
151
-
152
-
153
-
154
-
155
-
156
-
157
-
158
-
159
-
160
-
161
-
162
-
163
-
164
-
165
-
166
-
167
-
168
-
169
-
170
-
171
-
172
-
173
-
174
-
175
-
176
-
177
-
178
-
179
-
180
-
181
-
182
-
183
-
184
 |
 |

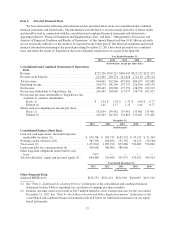
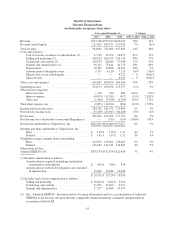
Item 6. Selected Financial Data
We have derived the following selected financial data presented below from our consolidated and combined
financial statements and related notes. The information set forth below is not necessarily indicative of future results
and should be read in conjunction with the consolidated and combined financial statements and related notes
appearing in Item 8 “Financial Statements and Supplementary Data” and Item 7 “Management’s Discussion and
Analysis of Financial Condition and Results of Operations” of this Annual Report on Form 10-K. Historical results
are not necessarily indicative of the results to be expected in any future period. The financial statements and related
financial information pertaining to the periods preceding December 21, 2011 have been presented on a combined
basis and reflect the results of TripAdvisor that were ultimately transferred to us as part of the Spin-Off.
Year Ended December 31,
2013 2012 2011 2010 2009
(in thousands, except per share data)
Consolidated and Combined Statements of Operations
Data:
Revenue .......................................... $727,236 $559,215 $426,045 $313,525 $212,375
Revenue from Expedia ............................... 217,425 203,751 211,018 171,110 139,714
Total revenue ...................................... 944,661 762,966 637,063 484,635 352,089
Operating income ................................... 294,574 296,296 272,757 226,300 168,178
Net Income ........................................ 205,443 194,588 177,791 138,954 102,215
Net income attributable to TripAdvisor, Inc. .............. 205,443 194,069 177,677 138,776 102,427
Net income per share attributable to TripAdvisor, Inc.
available to common shareholders:
Basic (1) ...................................... $ 1.44 $ 1.39 $ 1.33 $ 1.04 $ 0.77
Diluted (1) .................................... 1.41 1.37 1.32 1.04 0.77
Shares used in computing net income per share:
Basic (1) ...................................... 142,854 139,462 133,461 133,461 133,461
Diluted (1) .................................... 145,263 141,341 134,865 133,461 133,461
December 31,
2013 2012 2011 2010 2009
(in thousands)
Consolidated Balance Sheet Data:
Cash and cash equivalents, short and long term
marketable securities (2) .................... $ 670,706 $ 585,733 $183,532 $ 93,133 $ 31,364
Working capital (deficit) (2)(3) ................. 387,396 436,854 151,792 34,112 (78,560)
Total assets (2) .............................. 1,473,014 1,299,194 835,886 722,889 574,826
Long-term debt, less current portion (4) .......... 300,000 340,000 380,000 — —
Other long-term obligations under build to suit
lease .................................... 7,877 ————
Total stockholders’ equity and invested equity (5) . . 864,480 726,968 293,537 539,632 389,914
Year Ended December 31,
2013 2012 2011 2010 2009
(in thousands)
Other Financial Data:
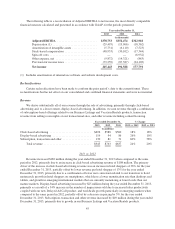
Adjusted EBITDA (6) ......................... $378,753 $352,474 $322,918 $260,963 $197,219
(1) See “Note 2—Significant Accounting Policies” in the notes to the consolidated and combined financial
statements in Item 8 below regarding our calculation of earnings per share numbers.
(2) Includes one-time exercise proceeds of $215 million related to stock warrant exercises for the year ended
December 31, 2012. See “Note 4—Stock Based Awards and Other Equity Instruments” in the notes to the
consolidated and combined financial statements in Item 8 below for additional information on our equity
based instruments.
37