TripAdvisor 2013 Annual Report Download - page 53
Download and view the complete annual report
Please find page 53 of the 2013 TripAdvisor annual report below. You can navigate through the pages in the report by either clicking on the pages listed below, or by using the keyword search tool below to find specific information within the annual report.-
 1
1 -
2
-
3
-
4
-
5
-
6
-
7
-
8
-
9
-
10
-
11
-
12
-
13
-
14
-
15
-
16
-
17
-
18
-
19
-
20
-
21
-
22
-
23
-
24
-
25
-
26
-
27
-
28
-
29
-
30
-
31
-
32
-
33
-
34
-
35
-
36
-
37
-
38
-
39
-
40
-
41
-
42
-
 43
43 -
 44
44 -
 45
45 -
 46
46 -
 47
47 -
 48
48 -
 49
49 -
 50
50 -
 51
51 -
 52
52 -
 53
53 -
 54
54 -
 55
55 -
 56
56 -
 57
57 -
 58
58 -
 59
59 -
 60
60 -
 61
61 -
 62
62 -
 63
63 -
64
-
65
-
66
-
67
-
68
-
69
-
70
-
71
-
72
-
73
-
74
-
75
-
76
-
77
-
78
-
79
-
80
-
81
-
82
-
83
-
84
-
85
-
86
-
87
-
88
-
89
-
90
-
91
-
92
-
93
-
94
-
95
-
96
-
97
-
98
-
99
-
100
-
101
-
102
-
103
-
104
-
105
-
106
-
107
-
108
-
109
-
110
-
111
-
112
-
113
-
114
-
115
-
116
-
117
-
118
-
119
-
120
-
121
-
122
-
123
-
124
-
125
-
126
-
127
-
128
-
129
-
130
-
131
-
132
-
133
-
134
-
135
-
136
-
137
-
138
-
139
-
140
-
141
-
142
-
143
-
144
-
145
-
146
-
147
-
148
-
149
-
150
-
151
-
152
-
153
-
154
-
155
-
156
-
157
-
158
-
159
-
160
-
161
-
162
-
163
-
164
-
165
-
166
-
167
-
168
-
169
-
170
-
171
-
172
-
173
-
174
-
175
-
176
-
177
-
178
-
179
-
180
-
181
-
182
-
183
-
184
 |
 |
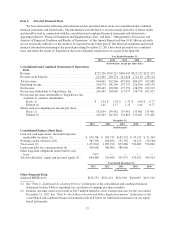
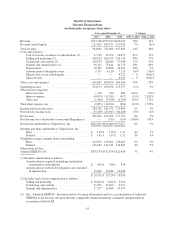
Results of Operations
Selected Financial Data
(in thousands, except per share data)
Year ended December 31, % Change
2013 2012 2011 2013 vs. 2012 2012 vs. 2011
Revenue ......................................... $727,236 $559,215 $426,045 30% 31%
Revenue from Expedia ............................. 217,425 203,751 211,018 7% (3)%
Total revenue ..................................... 944,661 762,966 637,063 24% 20%
Costs and expenses:
Cost of revenue (exclusive of amortization) (1) ...... 17,714 12,074 10,873 47% 11%
Selling and marketing (2) ....................... 368,353 266,239 209,176 38% 27%
Technology and content (2) ..................... 130,673 86,640 57,448 51% 51%
General and administrative (2) ................... 98,121 75,641 44,770 30% 69%
Depreciation ................................. 29,495 19,966 18,362 48% 9%
Amortization of intangible assets ................. 5,731 6,110 7,523 (6)% (19)%
Shared services fee with Expedia ................. — — 9,222 — % (100)%
Spin-off costs ................................. — — 6,932 — % (100)%
Total costs and expenses ............................ 650,087 466,670 364,306 39% 28%
Operating income ................................. 294,574 296,296 272,757 (1)% 9%
Other income (expense):
Interest income ............................... 1,738 510 808 241% (37)%
Interest expense ............................... (10,074) (11,381) (417) (11)% 2,629%
Other, net .................................... (1,536) (3,450) (1,254) (55)% 175%
Total other expense, net ............................ (9,872) (14,321) (863) (31)% 1,559%
Income before income taxes ......................... 284,702 281,975 271,894 1% 4%
Provision for income taxes .......................... (79,259) (87,387) (94,103) (9)% (7)%
Net income ....................................... 205,443 194,588 177,791 6% 9%
Net (income) loss attributable to noncontrolling interest . . . — (519) (114) (100)% 355%
Net income attributable to TripAdvisor, Inc. ............ $205,443 $194,069 $177,677 6% 9%
Earnings per share attributable to TripAdvisor, Inc :
Basic ....................................... $ 1.44 $ 1.39 $ 1.33 4% 5%
Diluted ...................................... $ 1.41 $ 1.37 $ 1.32 3% 4%
Weighted average common shares outstanding:
Basic ....................................... 142,854 139,462 133,461 2% 4%
Diluted ...................................... 145,263 141,341 134,865 3% 5%
Other financial data:
Adjusted EBITDA (3) .............................. $378,753 $352,474 $322,918 7% 9%
(1) Excludes amortization as follows:
Amortization of acquired technology included in
amortization of intangibles .................... $ 949$ 708$ 578
Amortization of website development costs included
in depreciation .............................. 19,602 12,816 12,438
$ 20,551 $ 13,524 $ 13,016
(2) Includes stock-based compensation as follows:
Selling and marketing .......................... $ 10,643 $ 4,622 $ 3,216
Technology and content ........................ 21,053 11,400 3,931
General and administrative ...................... 17,257 14,080 10,197
(3) See “Adjusted EBITDA” discussion below for more information and for a reconciliation of Adjusted
EBITDA to net income, the most directly comparable financial measure calculated and presented in
accordance with GAAP.
43