TripAdvisor 2013 Annual Report Download - page 57
Download and view the complete annual report
Please find page 57 of the 2013 TripAdvisor annual report below. You can navigate through the pages in the report by either clicking on the pages listed below, or by using the keyword search tool below to find specific information within the annual report.-
 1
1 -
2
-
3
-
4
-
5
-
6
-
7
-
8
-
9
-
10
-
11
-
12
-
13
-
14
-
15
-
16
-
17
-
18
-
19
-
20
-
21
-
22
-
23
-
24
-
25
-
26
-
27
-
28
-
29
-
30
-
31
-
32
-
33
-
34
-
35
-
36
-
37
-
38
-
39
-
40
-
41
-
42
-
43
-
44
-
45
-
46
-
 47
47 -
 48
48 -
 49
49 -
 50
50 -
 51
51 -
 52
52 -
 53
53 -
 54
54 -
 55
55 -
 56
56 -
 57
57 -
 58
58 -
 59
59 -
 60
60 -
 61
61 -
 62
62 -
 63
63 -
 64
64 -
 65
65 -
 66
66 -
 67
67 -
68
-
69
-
70
-
71
-
72
-
73
-
74
-
75
-
76
-
77
-
78
-
79
-
80
-
81
-
82
-
83
-
84
-
85
-
86
-
87
-
88
-
89
-
90
-
91
-
92
-
93
-
94
-
95
-
96
-
97
-
98
-
99
-
100
-
101
-
102
-
103
-
104
-
105
-
106
-
107
-
108
-
109
-
110
-
111
-
112
-
113
-
114
-
115
-
116
-
117
-
118
-
119
-
120
-
121
-
122
-
123
-
124
-
125
-
126
-
127
-
128
-
129
-
130
-
131
-
132
-
133
-
134
-
135
-
136
-
137
-
138
-
139
-
140
-
141
-
142
-
143
-
144
-
145
-
146
-
147
-
148
-
149
-
150
-
151
-
152
-
153
-
154
-
155
-
156
-
157
-
158
-
159
-
160
-
161
-
162
-
163
-
164
-
165
-
166
-
167
-
168
-
169
-
170
-
171
-
172
-
173
-
174
-
175
-
176
-
177
-
178
-
179
-
180
-
181
-
182
-
183
-
184
 |
 |

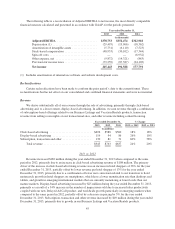
2012 vs. 2011
Revenue from Expedia decreased $7 million during the year ended December 31, 2012 when compared to
the same period in 2011, primarily due to lower CPC pricing paid by Expedia, partially offset by higher click
volume sent to Expedia in 2012.
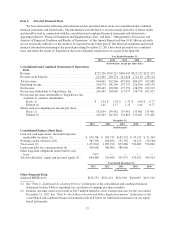
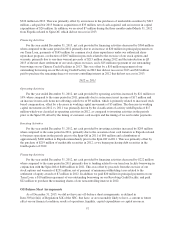
Cost of Revenue
Cost of revenue consists of expenses that are closely correlated or directly related to revenue generation,
including ad serving fees, flight search fees, credit card fees and data center costs.
Year ended December 31, % Change
2013 2012 2011 2013 vs. 2012 2012 vs. 2011
($ in millions)
Cost of revenue ................................... $18 $12 $11 47% 11%
% of revenue ..................................... 1.9% 1.6% 1.7%
2013 vs. 2012
Cost of revenue increased $6 million during the year ended December 31, 2013 when compared to the same
period in 2012, primarily due to increased data center costs, driven by higher site traffic and merchant credit card
fees.
2012 vs. 2011
Cost of revenue increased $1 million during the year ended December 31, 2012 when compared to the same
period in 2011, primarily due to increased merchant credit card fees.
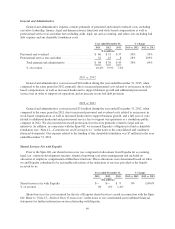
Selling and Marketing
Sales and marketing expenses primarily consist of direct costs, including search engine marketing, or SEM,
other traffic acquisition costs, syndication costs and affiliate program commissions, brand advertising and public
relations. In addition, our indirect sales and marketing expense consists of personnel and overhead expenses,
including salaries, commissions, benefits, stock-based compensation expense and bonuses for sales, sales
support, customer support and marketing employees.
Year ended December 31, % Change
2013 2012 2011 2013 vs. 2012 2012 vs. 2011
($ in millions)
Direct costs ........................................ $243 $177 $137 38% 29%
Personnel and overhead .............................. 125 89 72 40% 25%
Total selling and marketing ....................... $368 $266 $209 38% 27%
% of revenue ...................................... 39.0% 34.9% 32.8%
2013 vs. 2012
Direct selling and marketing costs increased $66 million during the year ended December 31, 2013 when
compared to the same period in 2012, primarily due to increased SEM costs, other traffic acquisition costs and
brand advertising costs, including offline advertising, partially offset by a decrease in spending in social media
costs. Personnel and overhead costs increased $36 million during the year ended December 31, 2013 when
compared to the same period in 2012, primarily due to an increase in headcount to support business growth,
including international expansion and employees joining us through recent business acquisitions, and also
increased stock-based compensation costs.
47