TripAdvisor 2013 Annual Report Download - page 62
Download and view the complete annual report
Please find page 62 of the 2013 TripAdvisor annual report below. You can navigate through the pages in the report by either clicking on the pages listed below, or by using the keyword search tool below to find specific information within the annual report.-
 1
1 -
2
-
3
-
4
-
5
-
6
-
7
-
8
-
9
-
10
-
11
-
12
-
13
-
14
-
15
-
16
-
17
-
18
-
19
-
20
-
21
-
22
-
23
-
24
-
25
-
26
-
27
-
28
-
29
-
30
-
31
-
32
-
33
-
34
-
35
-
36
-
37
-
38
-
39
-
40
-
41
-
42
-
43
-
44
-
45
-
46
-
47
-
48
-
49
-
50
-
51
-
 52
52 -
 53
53 -
 54
54 -
 55
55 -
 56
56 -
 57
57 -
 58
58 -
 59
59 -
 60
60 -
 61
61 -
 62
62 -
 63
63 -
 64
64 -
 65
65 -
 66
66 -
 67
67 -
 68
68 -
 69
69 -
 70
70 -
 71
71 -
 72
72 -
73
-
74
-
75
-
76
-
77
-
78
-
79
-
80
-
81
-
82
-
83
-
84
-
85
-
86
-
87
-
88
-
89
-
90
-
91
-
92
-
93
-
94
-
95
-
96
-
97
-
98
-
99
-
100
-
101
-
102
-
103
-
104
-
105
-
106
-
107
-
108
-
109
-
110
-
111
-
112
-
113
-
114
-
115
-
116
-
117
-
118
-
119
-
120
-
121
-
122
-
123
-
124
-
125
-
126
-
127
-
128
-
129
-
130
-
131
-
132
-
133
-
134
-
135
-
136
-
137
-
138
-
139
-
140
-
141
-
142
-
143
-
144
-
145
-
146
-
147
-
148
-
149
-
150
-
151
-
152
-
153
-
154
-
155
-
156
-
157
-
158
-
159
-
160
-
161
-
162
-
163
-
164
-
165
-
166
-
167
-
168
-
169
-
170
-
171
-
172
-
173
-
174
-
175
-
176
-
177
-
178
-
179
-
180
-
181
-
182
-
183
-
184
 |
 |

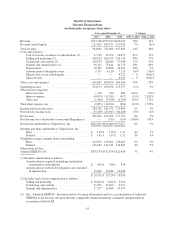
2013 vs. 2012
Our effective tax rates for the years ended December 31, 2013 and 2012 were 27.8% and 31.0%,
respectively. Our effective tax rate is less than the federal statutory rate primarily due to earnings in jurisdictions
outside the United States, where our effective tax rate is lower. This is partly driven by the current statutory tax
rate of 23% in the United Kingdom and our tax incentive on qualifying income in Singapore granted by the
Singapore Economic Development Board in 2011. Our effective tax rate is partially offset by state income taxes,
non-deductible stock compensation and accruals on uncertain tax positions.
The decrease in the effective tax rate for 2013 compared to the 2012 rate was primarily due to an increase in
earnings in jurisdictions outside the United States as well as an internal restructuring that occurred during the
fourth quarter of 2012. This restructuring was undertaken within our non-U.S. operations to align our global
structure for more efficient treasury management and global cash deployment.
During the third quarter of 2013, Massachusetts enacted a statute that changed how sales are apportioned
from being a cost of performance measure to market based sourcing. The impact of such will decrease our
overall state tax provision in 2014. Additionally, the United Kingdom statutory tax rate is set to decrease from
23% to 21% effective April 1, 2014, which will also reduce our effective tax rate.
2012 vs. 2011
Our effective tax rate was lower than the 35% federal statutory rate primarily due to earnings in jurisdictions
outside the United States, where our effective tax rate is lower, which was partially offset by state income taxes
and accruals on uncertain tax positions. The change in the effective rate for 2012 compared to the 2011 rate was
primarily due to an increase in earnings in jurisdictions outside the United States and a decrease in state income
taxes, as well as the internal restructuring.
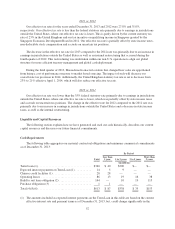
Liquidity and Capital Resources
The following section explains how we have generated and used our cash historically, describes our current
capital resources and discusses our future financial commitments.
Cash Requirements
The following table aggregates our material contractual obligations and minimum commercial commitments
as of December 31, 2013:
By Period
Total
Less than
1 year 1 to 3 years 3 to 5 years
More than
5 years
(in millions)
Term Loan (1) .................................... $340 $ 40 $300 $— $—
Expected interest payments on Term Loan (1) ........... 14 5 9 — —
Chinese credit facilities (1) .......................... 28 28 — — —
Operating leases .................................. 86 13 19 16 38
Build to suit lease obligation (2) ...................... 144 — 10 19 115
Purchase obligations (3) ............................ 1 1 — — —
Total (4)(5)(6) .................................... $613 $ 87 $338 $ 35 $153
(1) The amounts included as expected interest payments on the Term Loan in this table are based on the current
effective interest rate and payment terms as of December 31, 2013, but, could change significantly in the
52