TripAdvisor 2013 Annual Report Download - page 103
Download and view the complete annual report
Please find page 103 of the 2013 TripAdvisor annual report below. You can navigate through the pages in the report by either clicking on the pages listed below, or by using the keyword search tool below to find specific information within the annual report.-
 1
1 -
2
-
3
-
4
-
5
-
6
-
7
-
8
-
9
-
10
-
11
-
12
-
13
-
14
-
15
-
16
-
17
-
18
-
19
-
20
-
21
-
22
-
23
-
24
-
25
-
26
-
27
-
28
-
29
-
30
-
31
-
32
-
33
-
34
-
35
-
36
-
37
-
38
-
39
-
40
-
41
-
42
-
43
-
44
-
45
-
46
-
47
-
48
-
49
-
50
-
51
-
52
-
53
-
54
-
55
-
56
-
57
-
58
-
59
-
60
-
61
-
62
-
63
-
64
-
65
-
66
-
67
-
68
-
69
-
70
-
71
-
72
-
73
-
74
-
75
-
76
-
77
-
78
-
79
-
80
-
81
-
82
-
83
-
84
-
85
-
86
-
87
-
88
-
89
-
90
-
91
-
92
-
 93
93 -
 94
94 -
 95
95 -
 96
96 -
 97
97 -
 98
98 -
 99
99 -
 100
100 -
 101
101 -
 102
102 -
 103
103 -
 104
104 -
 105
105 -
 106
106 -
 107
107 -
 108
108 -
 109
109 -
 110
110 -
 111
111 -
 112
112 -
 113
113 -
114
-
115
-
116
-
117
-
118
-
119
-
120
-
121
-
122
-
123
-
124
-
125
-
126
-
127
-
128
-
129
-
130
-
131
-
132
-
133
-
134
-
135
-
136
-
137
-
138
-
139
-
140
-
141
-
142
-
143
-
144
-
145
-
146
-
147
-
148
-
149
-
150
-
151
-
152
-
153
-
154
-
155
-
156
-
157
-
158
-
159
-
160
-
161
-
162
-
163
-
164
-
165
-
166
-
167
-
168
-
169
-
170
-
171
-
172
-
173
-
174
-
175
-
176
-
177
-
178
-
179
-
180
-
181
-
182
-
183
-
184
 |
 |

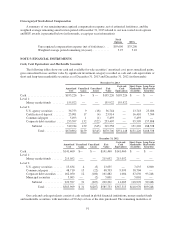
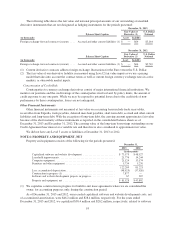
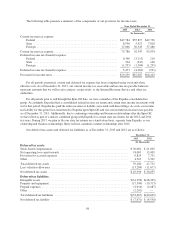
The following table shows the fair value and notional principal amounts of our outstanding or unsettled
derivative instruments that are not designated as hedging instruments for the periods presented:
December 31, 2013
Balance Sheet Caption
Fair Value of
Derivative (2)
U.S. Dollar
Notional
(in thousands) Asset Liability
Foreign exchange-forward contracts (current) .... Accrued and other current liabilities (1) $ — $64 $5,164
December 31, 2012
Balance Sheet Caption
Fair Value of
Derivative (2)
U.S. Dollar
Notional
(in thousands) Asset Liability
Foreign exchange-forward contracts (current) .... Accrued and other current liabilities (1) $ — $64 $2,710
(1) Current derivative contracts address foreign exchange fluctuations for the Euro versus the U.S. Dollar.
(2) The fair value of our derivative liability is measured using Level 2 fair value inputs as we use a pricing
model that takes into account the contract terms as well as current foreign currency exchange rates in active
markets, or observable market inputs.
Concentration of Credit Risk
Counterparties to currency exchange derivatives consist of major international financial institutions. We
monitor our positions and the credit ratings of the counterparties involved and, by policy limits, the amount of
credit exposure to any one party. While we may be exposed to potential losses due to the credit risk of non-
performance by these counterparties, losses are not anticipated.
Other Financial Instruments
Other financial instruments not measured at fair value on a recurring basis include trade receivables,
receivables from Expedia, trade payables, deferred merchant payables, short-term debt, accrued and other current
liabilities and long-term debt. With the exception of long-term debt, the carrying amount approximates fair value
because of the short maturity of these instruments as reported on the consolidated balance sheets as of
December 31, 2013 and December 31, 2012. The carrying value of the long-term borrowings outstanding on our
Credit Agreement bear interest at a variable rate and therefore is also considered to approximate fair value.
We did not have any Level 3 assets or liabilities at December 31, 2013 or 2012.
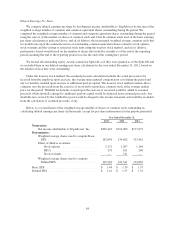
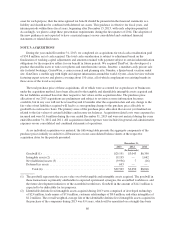
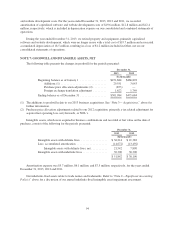
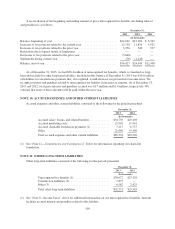
NOTE 6: PROPERTY AND EQUIPMENT, NET
Property and equipment consists of the following for the periods presented:
December 31,
2013 2012
(In thousands)
Capitalized software and website development ........................ $ 73,575 $ 48,527
Leasehold improvements .......................................... 21,776 14,244
Computer equipment ............................................. 21,124 13,174
Furniture and other equipment ..................................... 5,734 5,276
122,209 81,221
Less: accumulated depreciation ..................................... (48,625) (37,626)
Construction in progress (1) ....................................... 7,877 —
Software and website development projects in progress .................. 67 207
Property and equipment, net ....................................... $ 81,528 $ 43,802
(1) We capitalize construction in progress for build-to-suit lease agreements where we are considered the
owner, for accounting purposes only, during the construction period.
As of December 31, 2013 and 2012, our recorded capitalized software and website development costs, net
of accumulated amortization, were $46.2 million and $28.4 million, respectively. For the years ended
December 31, 2013 and 2012, we capitalized $38.4 million and $20.2 million, respectively, related to software
93