TripAdvisor 2013 Annual Report Download - page 66
Download and view the complete annual report
Please find page 66 of the 2013 TripAdvisor annual report below. You can navigate through the pages in the report by either clicking on the pages listed below, or by using the keyword search tool below to find specific information within the annual report.-
 1
1 -
2
-
3
-
4
-
5
-
6
-
7
-
8
-
9
-
10
-
11
-
12
-
13
-
14
-
15
-
16
-
17
-
18
-
19
-
20
-
21
-
22
-
23
-
24
-
25
-
26
-
27
-
28
-
29
-
30
-
31
-
32
-
33
-
34
-
35
-
36
-
37
-
38
-
39
-
40
-
41
-
42
-
43
-
44
-
45
-
46
-
47
-
48
-
49
-
50
-
51
-
52
-
53
-
54
-
55
-
 56
56 -
 57
57 -
 58
58 -
 59
59 -
 60
60 -
 61
61 -
 62
62 -
 63
63 -
 64
64 -
 65
65 -
 66
66 -
 67
67 -
 68
68 -
 69
69 -
 70
70 -
 71
71 -
 72
72 -
 73
73 -
 74
74 -
 75
75 -
 76
76 -
77
-
78
-
79
-
80
-
81
-
82
-
83
-
84
-
85
-
86
-
87
-
88
-
89
-
90
-
91
-
92
-
93
-
94
-
95
-
96
-
97
-
98
-
99
-
100
-
101
-
102
-
103
-
104
-
105
-
106
-
107
-
108
-
109
-
110
-
111
-
112
-
113
-
114
-
115
-
116
-
117
-
118
-
119
-
120
-
121
-
122
-
123
-
124
-
125
-
126
-
127
-
128
-
129
-
130
-
131
-
132
-
133
-
134
-
135
-
136
-
137
-
138
-
139
-
140
-
141
-
142
-
143
-
144
-
145
-
146
-
147
-
148
-
149
-
150
-
151
-
152
-
153
-
154
-
155
-
156
-
157
-
158
-
159
-
160
-
161
-
162
-
163
-
164
-
165
-
166
-
167
-
168
-
169
-
170
-
171
-
172
-
173
-
174
-
175
-
176
-
177
-
178
-
179
-
180
-
181
-
182
-
183
-
184
 |
 |

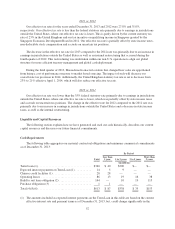
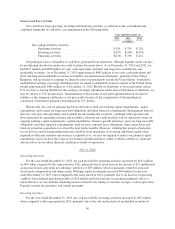
Sources and Uses of Cash
Our cash flows from operating, investing and financing activities, as reflected in the consolidated and
combined statements of cash flows, are summarized in the following table:
Year ended December 31,
2013 2012 2011
(in millions)
Net cash provided by (used in):
Operating activities ................................ $350 $239 $218
Investing activities ................................ $(197) $(244) $(539)
Financing activities ................................ $(170) $ 190 $ 412
Our principal source of liquidity is cash flows generated from operations, although liquidity needs can also
be met through drawdowns under our credit facilities discussed above. As of December 31, 2013 and 2012, we
had $671 million and $586 million of cash, cash equivalents and short and long-term available-for-sale
marketable securities. As of December 31, 2013 approximately $442 million of our cash, cash equivalents and
short and long-term marketable securities are held by our international subsidiaries, primarily in the United
Kingdom, and are related to earnings we intend to reinvest permanently outside the United States. Cumulative
undistributed earnings of foreign subsidiaries that we intend to indefinitely reinvest outside of the United States
totaled approximately $481 million as of December 31, 2013. Should we distribute, or be treated under certain
U.S. tax rules as having distributed, the earnings of foreign subsidiaries in the form of dividends or otherwise, we
may be subject to U.S. income taxes. Determination of the amount of any unrecognized deferred income tax
liability on this temporary difference is not practicable because of the complexities of the hypothetical
calculation. Cash held is primarily denominated in U.S. dollars.
Historically, the cash we generate has been sufficient to fund our working capital requirements, capital
expenditures and to meet our long term debt obligations and other financial commitments. Management believes
that our cash and cash equivalents and available for sale marketable securities, combined with expected cash
flows generated by operating activities and available cash from our credit facilities will be sufficient to fund our
ongoing working capital requirements, capital expenditures, business growth initiatives, meet our long term debt
obligations and other financial commitments, fund our new corporate lease obligations, share repurchases and
fund any potential acquisitions for at least the next twelve months. However, if during that period or thereafter,
we are not successful in generating sufficient cash flow from operations or in raising additional capital when
required in sufficient amounts and on terms acceptable to us, we may be required to reduce our planned capital
expenditures and scale back the scope of our business growth initiatives, either of which could have a material
adverse effect on our future financial condition or results of operations.
2013 vs. 2012
Operating Activities
For the year ended December 31, 2013, net cash provided by operating activities increased by $111 million
or 46% when compared to the same period in 2012, primarily due to an increase in net income of $11 million and
an increase in non-cash items not affecting cash flows of $35 million, which is primarily related to increased
stock based compensation and depreciation. Working capital movements increased $64 million for the year
ended December 31, 2013 when compared to the same period in 2012, primarily due to an increase in operating
cashflow from deferred merchant payables of $18 million and lower income tax payments primarily due to a
lower effective tax rate with the remaining increase related to the timing of customer receipts, cash receipts from
Expedia, income tax payments, and vendor payments.
Investing Activities
For the year ended December 31, 2013, net cash provided by investing activities increased by $47 million
when compared to the same period in 2012, primarily due to the sale and maturity of marketable securities of
56