TripAdvisor 2013 Annual Report Download - page 118
Download and view the complete annual report
Please find page 118 of the 2013 TripAdvisor annual report below. You can navigate through the pages in the report by either clicking on the pages listed below, or by using the keyword search tool below to find specific information within the annual report.-
 1
1 -
2
-
3
-
4
-
5
-
6
-
7
-
8
-
9
-
10
-
11
-
12
-
13
-
14
-
15
-
16
-
17
-
18
-
19
-
20
-
21
-
22
-
23
-
24
-
25
-
26
-
27
-
28
-
29
-
30
-
31
-
32
-
33
-
34
-
35
-
36
-
37
-
38
-
39
-
40
-
41
-
42
-
43
-
44
-
45
-
46
-
47
-
48
-
49
-
50
-
51
-
52
-
53
-
54
-
55
-
56
-
57
-
58
-
59
-
60
-
61
-
62
-
63
-
64
-
65
-
66
-
67
-
68
-
69
-
70
-
71
-
72
-
73
-
74
-
75
-
76
-
77
-
78
-
79
-
80
-
81
-
82
-
83
-
84
-
85
-
86
-
87
-
88
-
89
-
90
-
91
-
92
-
93
-
94
-
95
-
96
-
97
-
98
-
99
-
100
-
101
-
102
-
103
-
104
-
105
-
106
-
107
-
 108
108 -
 109
109 -
 110
110 -
 111
111 -
 112
112 -
 113
113 -
 114
114 -
 115
115 -
 116
116 -
 117
117 -
 118
118 -
 119
119 -
 120
120 -
 121
121 -
 122
122 -
 123
123 -
 124
124 -
 125
125 -
 126
126 -
 127
127 -
 128
128 -
129
-
130
-
131
-
132
-
133
-
134
-
135
-
136
-
137
-
138
-
139
-
140
-
141
-
142
-
143
-
144
-
145
-
146
-
147
-
148
-
149
-
150
-
151
-
152
-
153
-
154
-
155
-
156
-
157
-
158
-
159
-
160
-
161
-
162
-
163
-
164
-
165
-
166
-
167
-
168
-
169
-
170
-
171
-
172
-
173
-
174
-
175
-
176
-
177
-
178
-
179
-
180
-
181
-
182
-
183
-
184
 |
 |

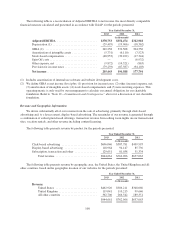
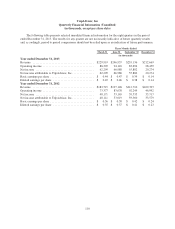
The following table is a reconciliation of Adjusted EBITDA to net income, the most directly comparable
financial measure calculated and presented in accordance with GAAP, for the periods presented:
Year Ended December 31,
2013 2012 2011
(in thousands)
Adjusted EBITDA ........................... $378,753 $352,474 $322,918
Depreciation (1) .............................. (29,495) (19,966) (18,362)
OIBA (2) ................................... 349,258 332,508 304,556
Amortization of intangible assets ................. (5,731) (6,110) (7,523)
Stock-based compensation ...................... (48,953) (30,102) (17,344)
Spin-Off costs ................................ — — (6,932)
Other expense, net ............................ (9,872) (14,321) (863)
Provision for income taxes ...................... (79,259) (87,387) (94,103)
Net income .................................. 205,443 194,588 177,791
(1) Includes amortization of internal use software and website development costs.
(2) We define OIBA as net income (loss) plus: (1) provision for income taxes; (2) other (income) expense, net;
(3) amortization of intangible assets; (4) stock-based compensation; and (5) non-recurring expenses. This
operating metric is only used by our management to calculate our annual obligation for our charitable
foundation. Refer to “Note 12—Commitments and Contingencies” above for a discussion of our charitable
foundation.
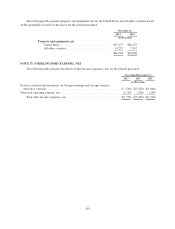
Revenue and Geographic Information
We derive substantially all of our revenue from the sale of advertising, primarily through click-based
advertising and, to a lesser extent, display-based advertising. The remainder of our revenue is generated through
a combination of subscription-based offerings, transaction revenue from selling room nights on our transactional
sites, vacation rentals, and other revenue including content licensing.
The following table presents revenue by product for the periods presented:
Year Ended December 31,
2013 2012 2011
(in thousands)
Click-based advertising ........................ $696,046 $587,781 $499,993
Display-based advertising ...................... 118,964 94,147 85,736
Subscription, transaction and other ............... 129,651 81,038 51,334
Total revenue ............................ $944,661 $762,966 $637,063
The following table presents revenue by geographic area, the United States, the United Kingdom and all
other countries, based on the geographic location of our websites for the periods presented:
Year Ended December 31,
2013 2012 2011
(in thousands)
Revenue
United States ............................ $462,920 $386,211 $348,066
United Kingdom .......................... 119,041 110,213 99,646
All other countries ........................ 362,700 266,542 189,351
$944,661 $762,966 $637,063
108