TripAdvisor 2013 Annual Report Download - page 55
Download and view the complete annual report
Please find page 55 of the 2013 TripAdvisor annual report below. You can navigate through the pages in the report by either clicking on the pages listed below, or by using the keyword search tool below to find specific information within the annual report.-
 1
1 -
2
-
3
-
4
-
5
-
6
-
7
-
8
-
9
-
10
-
11
-
12
-
13
-
14
-
15
-
16
-
17
-
18
-
19
-
20
-
21
-
22
-
23
-
24
-
25
-
26
-
27
-
28
-
29
-
30
-
31
-
32
-
33
-
34
-
35
-
36
-
37
-
38
-
39
-
40
-
41
-
42
-
43
-
44
-
 45
45 -
 46
46 -
 47
47 -
 48
48 -
 49
49 -
 50
50 -
 51
51 -
 52
52 -
 53
53 -
 54
54 -
 55
55 -
 56
56 -
 57
57 -
 58
58 -
 59
59 -
 60
60 -
 61
61 -
 62
62 -
 63
63 -
 64
64 -
 65
65 -
66
-
67
-
68
-
69
-
70
-
71
-
72
-
73
-
74
-
75
-
76
-
77
-
78
-
79
-
80
-
81
-
82
-
83
-
84
-
85
-
86
-
87
-
88
-
89
-
90
-
91
-
92
-
93
-
94
-
95
-
96
-
97
-
98
-
99
-
100
-
101
-
102
-
103
-
104
-
105
-
106
-
107
-
108
-
109
-
110
-
111
-
112
-
113
-
114
-
115
-
116
-
117
-
118
-
119
-
120
-
121
-
122
-
123
-
124
-
125
-
126
-
127
-
128
-
129
-
130
-
131
-
132
-
133
-
134
-
135
-
136
-
137
-
138
-
139
-
140
-
141
-
142
-
143
-
144
-
145
-
146
-
147
-
148
-
149
-
150
-
151
-
152
-
153
-
154
-
155
-
156
-
157
-
158
-
159
-
160
-
161
-
162
-
163
-
164
-
165
-
166
-
167
-
168
-
169
-
170
-
171
-
172
-
173
-
174
-
175
-
176
-
177
-
178
-
179
-
180
-
181
-
182
-
183
-
184
 |
 |

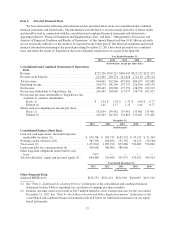
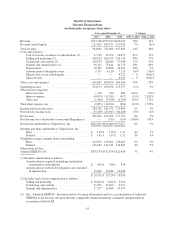
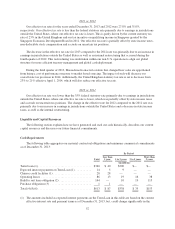
The following table is a reconciliation of Adjusted EBITDA to net income, the most directly comparable
financial measure calculated and presented in accordance with GAAP, for the periods presented:
Year ended December 31,
2013 2012 2011
(in thousands)
Adjusted EBITDA ........................... $378,753 $352,474 $322,918
Depreciation (1) .............................. (29,495) (19,966) (18,362)
Amortization of intangible assets ................. (5,731) (6,110) (7,523)
Stock-based compensation ...................... (48,953) (30,102) (17,344)
Spin-off costs ................................ — — (6,932)
Other expense, net ............................ (9,872) (14,321) (863)
Provision for income taxes ...................... (79,259) (87,387) (94,103)
Net income 205,443 194,588 177,791
(1) Includes amortization of internal use software and website development costs.
Reclassifications
Certain reclassifications have been made to conform the prior period’s data to the current format. These
reclassifications had no net effect on our consolidated and combined financial statements and were not material.
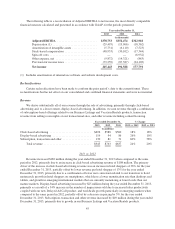
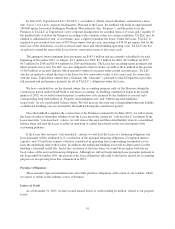
Revenue
We derive substantially all of our revenue through the sale of advertising, primarily through click-based
advertising and, to a lesser extent, display-based advertising. In addition, we earn revenue through a combination
of subscription-based offerings related to our Business Listings and Vacation Rentals products, transaction
revenue from selling room nights on our transactional sites, and other revenue including content licensing.
Year ended December 31, % Change
2013 2012 2011 2013 vs. 2012 2012 vs. 2011
(in millions)
Click-based advertising ............................ $696 $588 $500 18% 18%
Display-based advertising .......................... 119 94 86 26% 10%
Subscription, transaction and other ................... 130 81 51 60% 58%
Total revenue ................................ $945 $763 $637 24% 20%
2013 vs. 2012
Revenue increased $182 million during the year ended December 31, 2013 when compared to the same
period in 2012, primarily due to an increase in click-based advertising revenue of $108 million. The primary
driver of the increase in click-based advertising revenue was an increase in hotel shoppers of 36% for the year
ended December 31, 2013, partially offset by lower revenue per hotel shopper of 13% for the year ended
December 31, 2013, primarily due to a combination of lower user conversion related to our transition to hotel
metasearch, growth in hotel shoppers on smartphones, which have a lower monetization rate than desktops and
tablets, and growth in emerging international markets that are currently monetizing at lower levels than our
mature markets. Display-based advertising increased by $25 million during the year ended December 31, 2013,
primarily as a result of a 34% increase in the number of impressions sold due to increased sales productivity
coupled with our new Delayed Ad Call product, and worldwide growth particularly in emerging markets when
compared to the same period in 2012, partially offset by a decrease in pricing by 5% for the year ended
December 31, 2013. Subscription, transaction and other revenue increased by $49 million during the year ended
December 31, 2013, primarily due to growth in our Business Listings and Vacation Rentals products.
45