TripAdvisor 2013 Annual Report Download - page 60
Download and view the complete annual report
Please find page 60 of the 2013 TripAdvisor annual report below. You can navigate through the pages in the report by either clicking on the pages listed below, or by using the keyword search tool below to find specific information within the annual report.-
 1
1 -
2
-
3
-
4
-
5
-
6
-
7
-
8
-
9
-
10
-
11
-
12
-
13
-
14
-
15
-
16
-
17
-
18
-
19
-
20
-
21
-
22
-
23
-
24
-
25
-
26
-
27
-
28
-
29
-
30
-
31
-
32
-
33
-
34
-
35
-
36
-
37
-
38
-
39
-
40
-
41
-
42
-
43
-
44
-
45
-
46
-
47
-
48
-
49
-
 50
50 -
 51
51 -
 52
52 -
 53
53 -
 54
54 -
 55
55 -
 56
56 -
 57
57 -
 58
58 -
 59
59 -
 60
60 -
 61
61 -
 62
62 -
 63
63 -
 64
64 -
 65
65 -
 66
66 -
 67
67 -
 68
68 -
 69
69 -
 70
70 -
71
-
72
-
73
-
74
-
75
-
76
-
77
-
78
-
79
-
80
-
81
-
82
-
83
-
84
-
85
-
86
-
87
-
88
-
89
-
90
-
91
-
92
-
93
-
94
-
95
-
96
-
97
-
98
-
99
-
100
-
101
-
102
-
103
-
104
-
105
-
106
-
107
-
108
-
109
-
110
-
111
-
112
-
113
-
114
-
115
-
116
-
117
-
118
-
119
-
120
-
121
-
122
-
123
-
124
-
125
-
126
-
127
-
128
-
129
-
130
-
131
-
132
-
133
-
134
-
135
-
136
-
137
-
138
-
139
-
140
-
141
-
142
-
143
-
144
-
145
-
146
-
147
-
148
-
149
-
150
-
151
-
152
-
153
-
154
-
155
-
156
-
157
-
158
-
159
-
160
-
161
-
162
-
163
-
164
-
165
-
166
-
167
-
168
-
169
-
170
-
171
-
172
-
173
-
174
-
175
-
176
-
177
-
178
-
179
-
180
-
181
-
182
-
183
-
184
 |
 |

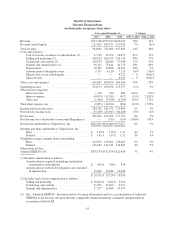
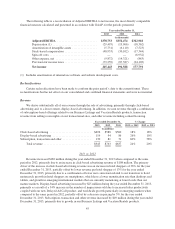
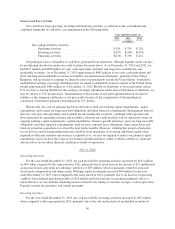
Depreciation
Year ended December 31, % Change
2013 2012 2011 2013 vs. 2012 2012 vs. 2011
($ in millions)
Depreciation ....................................... $29 $20 $18 48% 9%
% of revenue ...................................... 3.1% 2.6% 2.9%
2013 vs. 2012
Depreciation expense increased $9 million during the year ended December 31, 2013 when compared to the
same period in 2012 primarily due to increased amortization related to capitalized software and website
development costs.
2012 vs. 2011
Depreciation expense increased $2 million during the year ended December 31, 2012 when compared to the
same period in 2011 primarily due to increased amortization related to capitalized software and website
development costs and additional depreciation of $1 million related to purchased software licenses and leasehold
improvements.
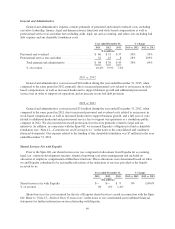
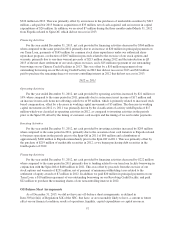
Amortization of Intangible Assets
Year ended December 31, % Change
2013 2012 2011 2013 vs. 2012 2012 vs. 2011
($ in millions)
Amortization of intangible assets ..................... $ 6 $ 6 $ 8 (6)% (19)%
% of revenue .................................... 0.6% 0.8% 1.2%
2013 vs. 2012
Amortization of intangible assets did not materially change during the year ended December 31, 2013 when
compared to the same period in 2012. Amortization related to acquired definite lived intangibles from business
acquisitions during 2013 was more than offset by the completion of amortization related to certain technology
intangible assets from prior years.
2012 vs. 2011
Amortization of intangible assets decreased $2 million during the year ended December 31, 2012 when
compared to the same period in 2011, primarily due to the completion of amortization related to certain
technology intangible assets.
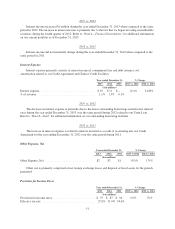
Interest Income
Interest income primarily consists of interest earned and amortization of discounts and premiums on our
marketable securities.
Year ended December 31, % Change
2013 2012 2011 2013 vs. 2012 2012 vs. 2011
($ in millions)
Interest income ................................... $ 2 $ 1 $ 1 241% (37)%
% of revenue .................................... 0.2% 0.1% 0.1%
50