Saks Fifth Avenue 2011 Annual Report Download - page 82
Download and view the complete annual report
Please find page 82 of the 2011 Saks Fifth Avenue annual report below. You can navigate through the pages in the report by either clicking on the pages listed below, or by using the keyword search tool below to find specific information within the annual report.-
 1
1 -
2
-
3
-
4
-
5
-
6
-
7
-
8
-
9
-
10
-
11
-
12
-
13
-
14
-
15
-
16
-
17
-
18
-
19
-
20
-
21
-
22
-
23
-
24
-
25
-
26
-
27
-
28
-
29
-
30
-
31
-
32
-
33
-
34
-
35
-
36
-
37
-
38
-
39
-
40
-
41
-
42
-
43
-
44
-
45
-
46
-
47
-
48
-
49
-
50
-
51
-
52
-
53
-
54
-
55
-
56
-
57
-
58
-
59
-
60
-
61
-
62
-
63
-
64
-
65
-
66
-
67
-
68
-
69
-
70
-
71
-
 72
72 -
 73
73 -
 74
74 -
 75
75 -
 76
76 -
 77
77 -
 78
78 -
 79
79 -
 80
80 -
 81
81 -
 82
82 -
 83
83 -
 84
84 -
 85
85 -
 86
86 -
 87
87 -
 88
88 -
 89
89 -
 90
90 -
 91
91
 |
 |

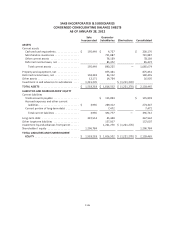
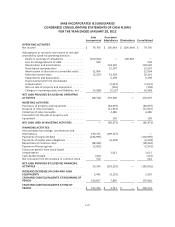
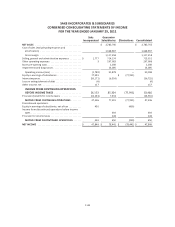
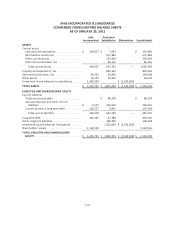
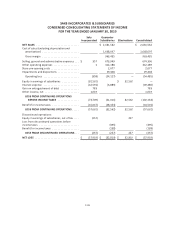
SAKS INCORPORATED & SUBSIDIARIES
CONDENSED CONSOLIDATING STATEMENTS OF CASH FLOWS
FOR THE YEAR ENDED JANUARY 28, 2012
Saks
Incorporated
Guarantor
Subsidiaries Eliminations Consolidated
OPERATING ACTIVITIES
Net income ................................. $ 74,790 $ 100,464 $ (100,464) $ 74,790
Adjustments to reconcile net income to net cash
provided by (used in) operating activities:
Equity in earnings of subsidiaries .............. (100,464) — 100,464 —
Loss on extinguishment of debt ............... 539 539
Depreciation and amortization ............... 118,540 118,540
Stock-based compensation .................. 15,597 15,597
Amortization of discount on convertible notes . . . 12,964 12,964
Deferred income taxes ...................... (2,297) 31,558 29,261
Impairments and dispositions ................ 5,190 5,190
Excess tax benefit from stock-based
compensation ............................. (1,011) (1,011)
Gain on sale of property and equipment ........ (156) (156)
Changes in operating assets and liabilities, net . . . (4,284) 21,267 16,983
NET CASH PROVIDED BY (USED IN) OPERATING
ACTIVITIES ................................. (18,752) 291,449 — 272,697
INVESTING ACTIVITIES
Purchases of property and equipment ............ (82,097) (82,097)
Issuance of note receivable .................... (11,915) (11,915)
Collection of note receivable ................... 4,485 4,485
Proceeds from the sale of property and
equipment ................................. 156 156
NET CASH USED IN INVESTING ACTIVITIES ........ — (89,371) — (89,371)
FINANCING ACTIVITIES
Intercompany borrowings, contributions and
distributions ................................ 199,727 (199,727) —
Payments of long-term debt ................... (143,995) (143,995)
Payments of capital lease obligations ............ (6,494) (6,494)
Repurchase of common stock .................. (28,932) (28,932)
Payment of financing fees ..................... (2,961) (2,961)
Excess tax benefit from stock-based
compensation ............................... 1,011 1,011
Cash dividends paid .......................... (161) (161)
Net proceeds from the issuance of common stock . . 516 516
NET CASH PROVIDED BY (USED IN) FINANCING
ACTIVITIES ................................. 24,194 (205,210) — (181,016)
INCREASE (DECREASE) IN CASH AND CASH
EQUIVALENTS ............................... 5,442 (3,132) 2,310
CASH AND CASH EQUIVALENTS AT BEGINNING OF
PERIOD .................................... 190,007 7,859 197,866
CASH AND CASH EQUIVALENTS AT END OF
PERIOD .................................... $ 195,449 $ 4,727 $ — $ 200,176
F-37