Saks Fifth Avenue 2011 Annual Report Download - page 20
Download and view the complete annual report
Please find page 20 of the 2011 Saks Fifth Avenue annual report below. You can navigate through the pages in the report by either clicking on the pages listed below, or by using the keyword search tool below to find specific information within the annual report.-
 1
1 -
2
-
3
-
4
-
5
-
6
-
7
-
8
-
9
-
 10
10 -
 11
11 -
 12
12 -
 13
13 -
 14
14 -
 15
15 -
 16
16 -
 17
17 -
 18
18 -
 19
19 -
 20
20 -
 21
21 -
 22
22 -
 23
23 -
 24
24 -
 25
25 -
 26
26 -
 27
27 -
 28
28 -
 29
29 -
 30
30 -
31
-
32
-
33
-
34
-
35
-
36
-
37
-
38
-
39
-
40
-
41
-
42
-
43
-
44
-
45
-
46
-
47
-
48
-
49
-
50
-
51
-
52
-
53
-
54
-
55
-
56
-
57
-
58
-
59
-
60
-
61
-
62
-
63
-
64
-
65
-
66
-
67
-
68
-
69
-
70
-
71
-
72
-
73
-
74
-
75
-
76
-
77
-
78
-
79
-
80
-
81
-
82
-
83
-
84
-
85
-
86
-
87
-
88
-
89
-
90
-
91
 |
 |

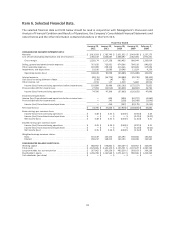
Item 6. Selected Financial Data.
The selected financial data set forth below should be read in conjunction with Management’s Discussion and
Analysis of Financial Condition and Results of Operations, the Company’s Consolidated Financial Statements and
notes thereto and the other information contained elsewhere in this Form 10-K.
Fiscal Year Ended
January 28,
2012
January 29,
2011
January 30,
2010
January 31,
2009
February 2,
2008
CONSOLIDATED INCOME STATEMENT DATA:
Net sales ................................................$ 3,013,593 $ 2,785,745 $ 2,631,532 $ 3,043,438 $ 3,237,275
Cost of sales (excluding depreciation and amortization) ........... 1,785,419 1,668,487 1,668,097 2,062,494 1,972,251
Gross margin ........................................... 1,228,174 1,117,258 963,435 980,944 1,265,024
Selling, general and administrative expenses ................... 767,635 715,951 674,306 784,510 840,823
Other operating expenses .................................. 302,089 298,124 314,266 320,683 317,046
Impairments and dispositions ............................... 10,106 13,085 29,348 11,139 4,279
Operating income (loss) .................................. 148,344 90,098 (54,485) (135,388) 102,876
Interest expense .......................................... (48,115) (56,725) (49,480) (45,739) (48,303)
Gain (loss) on extinguishment of debt ......................... (539) (4) 783 — (5,634)
Other income, net ........................................ 2,194 117 1,019 5,600 24,912
Income (loss) from continuing operations before income taxes . . . 101,884 33,486 (102,163) (175,527) 73,851
Provision (benefit) for income taxes .......................... 27,094 (13,910) (44,501) (48,902) 26,755
Income (loss) from continuing operations .................... 74,790 47,396 (57,662) (126,625) 47,096
Discontinued operations:
Income (loss) from discontinued operations before income taxes . . . — 693 (395) (52,727) (4,860)
Provision (benefit) for income taxes .......................... — 243 (138) (20,548) (1,646)
Income (loss) from discontinued operations .................. — 450 (257) (32,179) (3,214)
Net income (loss) .........................................$ 74,790 $ 47,846 $ (57,919) $ (158,804) $ 43,882
Basic earnings per common share:
Income (loss) from continuing operations ....................$ 0.48 $ 0.31 $ (0.40) $ (0.93) $ 0.33
Income (loss) from discontinued operations ..................$ — $ — $ — $ (0.23) $ (0.02)
Net income (loss) .......................................$ 0.48 $ 0.31 $ (0.40) $ (1.15) $ 0.31
Diluted earnings per common share:
Income (loss) from continuing operations ....................$ 0.45 $ 0.30 $ (0.40) $ (0.92) $ 0.31
Income (loss) from discontinued operations ..................$ — $ — $ — $ (0.23) $ (0.02)
Net income (loss) .......................................$ 0.45 $ 0.30 $ (0.40) $ (1.15) $ 0.29
Weighted-average common shares:
Basic ................................................. 155,149 154,325 143,194 138,384 140,402
Diluted ............................................... 200,237 158,413 143,194 138,384 153,530
CONSOLIDATED BALANCE SHEET DATA:
Working capital ..........................................$ 688,962 $ 578,862 $ 546,169 $ 503,952 $ 345,097
Total assets ..............................................$ 2,128,465 $ 2,143,100 $ 2,135,701 $ 2,147,677 $ 2,350,744
Long-term debt, less current portion ..........................$ 367,962 $ 359,250 $ 493,330 $ 593,103 $ 204,238
Shareholders’ equity ......................................$ 1,206,784 $ 1,163,565 $ 1,071,610 $ 990,586 $ 1,204,434
Cash dividends (per share) ..................................$ — $ — $ — $ — $ —
18