Saks Fifth Avenue 2011 Annual Report Download - page 76
Download and view the complete annual report
Please find page 76 of the 2011 Saks Fifth Avenue annual report below. You can navigate through the pages in the report by either clicking on the pages listed below, or by using the keyword search tool below to find specific information within the annual report.-
 1
1 -
2
-
3
-
4
-
5
-
6
-
7
-
8
-
9
-
10
-
11
-
12
-
13
-
14
-
15
-
16
-
17
-
18
-
19
-
20
-
21
-
22
-
23
-
24
-
25
-
26
-
27
-
28
-
29
-
30
-
31
-
32
-
33
-
34
-
35
-
36
-
37
-
38
-
39
-
40
-
41
-
42
-
43
-
44
-
45
-
46
-
47
-
48
-
49
-
50
-
51
-
52
-
53
-
54
-
55
-
56
-
57
-
58
-
59
-
60
-
61
-
62
-
63
-
64
-
65
-
 66
66 -
 67
67 -
 68
68 -
 69
69 -
 70
70 -
 71
71 -
 72
72 -
 73
73 -
 74
74 -
 75
75 -
 76
76 -
 77
77 -
 78
78 -
 79
79 -
 80
80 -
 81
81 -
 82
82 -
 83
83 -
 84
84 -
 85
85 -
 86
86 -
87
-
88
-
89
-
90
-
91
 |
 |

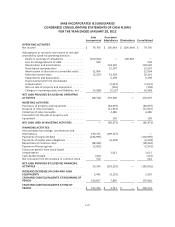
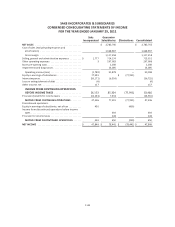
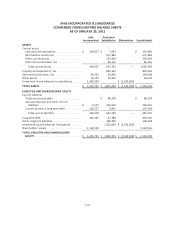
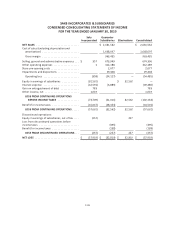
SAKS INCORPORATED & SUBSIDIARIES
NOTES TO CONSOLIDATED FINANCIAL STATEMENTS
(In thousands, except per share amounts)
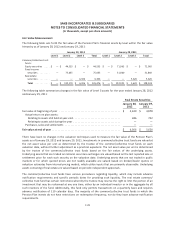
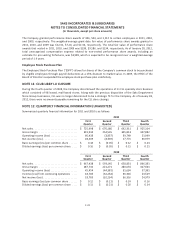
A summary of the stock option activity for 2011 is presented below:
2011
Shares
Weighted
Average
Exercise
Price
Aggregate
Intrinsic
Value
Weighted
Average
Remaining
Contractual
Life (Years)
Outstanding at beginning of year .................... 1,906 $ 11.89
Granted ...................................... — —
Exercised ..................................... (183) 2.82
Forfeited ..................................... (77) 13.35
Outstanding at end of year ......................... 1,646 $ 12.83 $ 2,541 2.9
Options exercisable at end of year ................... 1,127 $ 15.81 $ 143 2.6
Options expected to vest .......................... 512 $ 6.26 $ 2,399 3.7
There were no stock options granted during 2011 or 2010. The weighted-average grant-date fair value of stock
options granted during 2009 was $1.15. The total intrinsic value of stock options exercised during 2011, 2010,
and 2009 was $1,650, $1,888, and $115, respectively. The net tax benefit realized from stock options exercised
during 2011 was $559. Cash proceeds received from the exercise of stock options during 2011 was $516. The
total fair value of stock options vested during 2011, 2010, and 2009 was $2,146, $2,169, and $2,265,
respectively. As of January 28, 2012, total unrecognized compensation expense related to non-vested stock
options, including an estimate for pre-vesting forfeitures, was $298, which is expected to be recognized over a
weighted-average period of 0.8 years.
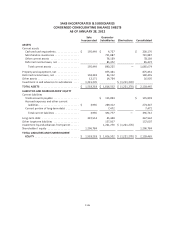
The following table summarizes information about stock options outstanding and exercisable as of January 28,
2012:
Options Outstanding Options Exercisable
Range of Exercise Prices
Number
Outstanding
at January 28,
2012
Weighted
Average
Remaining
Contractual
Life (Years)
Weighted
Average
Exercise
Price
Number
Exercisable
at January 28,
2012
Weighted
Average
Remaining
Contractual
Life (Years)
Weighted
Average
Exercise
Price
$2.36 to $6.64 ........ 351 3.9 $ 2.59 26 1.4 $ 5.42
$6.65 to $8.07 ........ 15 0.4 $ 7.71 15 0.4 $ 7.71
$8.08 to $13.04 ....... 777 3.1 $ 13.04 583 3.1 $ 13.04
$13.05 to $20.31 ...... 503 2.1 $ 19.80 503 2.1 $ 19.80
1,646 2.9 $ 12.83 1,127 2.6 $ 15.81
F-31