Saks Fifth Avenue 2011 Annual Report Download - page 24
Download and view the complete annual report
Please find page 24 of the 2011 Saks Fifth Avenue annual report below. You can navigate through the pages in the report by either clicking on the pages listed below, or by using the keyword search tool below to find specific information within the annual report.-
 1
1 -
2
-
3
-
4
-
5
-
6
-
7
-
8
-
9
-
10
-
11
-
12
-
13
-
 14
14 -
 15
15 -
 16
16 -
 17
17 -
 18
18 -
 19
19 -
 20
20 -
 21
21 -
 22
22 -
 23
23 -
 24
24 -
 25
25 -
 26
26 -
 27
27 -
 28
28 -
 29
29 -
 30
30 -
 31
31 -
 32
32 -
 33
33 -
 34
34 -
35
-
36
-
37
-
38
-
39
-
40
-
41
-
42
-
43
-
44
-
45
-
46
-
47
-
48
-
49
-
50
-
51
-
52
-
53
-
54
-
55
-
56
-
57
-
58
-
59
-
60
-
61
-
62
-
63
-
64
-
65
-
66
-
67
-
68
-
69
-
70
-
71
-
72
-
73
-
74
-
75
-
76
-
77
-
78
-
79
-
80
-
81
-
82
-
83
-
84
-
85
-
86
-
87
-
88
-
89
-
90
-
91
 |
 |
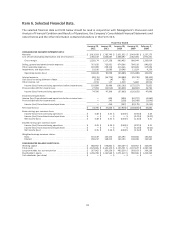
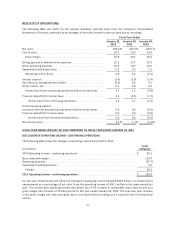
NET SALES
For the year ended January 28, 2012, total net sales increased 8.2% to $3,013.6 million from $2,785.7 million for
the year ended January 29, 2011. Consolidated comparable store sales increased $252.8 million, or 9.5%, from
$2,658.2 million for the year ended January 29, 2011 to $2,911.0 million for the year ended January 28, 2012.
Comparable store sales are calculated on a rolling 13-month basis. Thus, to be included in the comparison, a
store must be open for 13 months. The additional month is used to transition the first month impact of a new
store opening. Correspondingly, closed stores are removed from the comparable store sales comparison when
they begin liquidating merchandise. Expanded or remodeled stores are included in the comparable store sales
comparison, except for the periods in which they are closed for remodeling and renovation.
GROSS MARGIN
For the year ended January 28, 2012, gross margin was $1,228.2 million, or 40.8% of net sales, compared to
$1,117.3 million, or 40.1% of net sales, for the year ended January 29, 2011. The increase in gross margin dollars
and gross margin rate was primarily the result of higher sales, increased full-price selling and a reduced level of
promotional activity.
SELLING, GENERAL AND ADMINISTRATIVE EXPENSES (“SG&A”)
For the year ended January 28, 2012, SG&A was $767.6 million, or 25.5% of net sales, compared to $716.0
million, or 25.7% of net sales, for the year ended January 29, 2011. The increase of $51.6 million in expenses
was primarily driven by higher variable costs associated with the $227.9 million sales increase for the year as
well as incremental expenses incurred to support the growth in Saks Direct. Additionally, the Company
experienced an increase in proprietary credit card income related to the previously announced contract
changes with HSBC.
OTHER OPERATING EXPENSES
For the year ended January 28, 2012, other operating expenses were $302.1 million, or 10.0% of net sales,
compared to $298.1 million, or 10.7% of net sales, for the year ended January 29, 2011. The increase of $4.0
million was principally driven by an increase in taxes other than income taxes of $2.9 million, an increase in
property and equipment rentals of $0.7 million and an increase in store pre-opening costs of $0.6 million. These
increases were partially offset by a decrease in depreciation and amortization of $0.2 million.
IMPAIRMENTS AND DISPOSITIONS
For the year ended January 28, 2012, impairments and dispositions included net charges of $10.1 million
compared to net charges of $13.1 million for the year ended January 29, 2011. During 2011, the Company
incurred $4.9 million of store-closing related costs, primarily driven by a lease termination charge incurred in
connection with the relocation of the Hilton Head OFF 5TH store. Also included in impairments and dispositions
for 2011 were $5.0 million of asset impairments and $0.2 million of asset dispositions in the normal course of
business. The prior year charges of $13.1 million included store-closing costs of $12.1 million associated with
the closing of seven SFA stores and one OFF 5TH store and $1.0 million of asset impairments and dispositions in
the normal course of business.
INTEREST EXPENSE
Interest expense decreased to $48.1 million in 2011 from $56.7 million in 2010 and, as a percentage of net
sales, was 1.6% in 2011 and 2.0% in 2010. The decrease of $8.6 million was primarily due to the extinguishment
of $22.9 million of the 7.5% senior notes that matured in December 2010 and extinguishment of $141.6 million
of the 9.875% senior notes that matured in October 2011. Non-cash interest expense associated with the
amortization of the debt discount on the Company’s convertible notes was $13.0 million and $11.9 million for
the years ended January 28, 2012 and January 29, 2011, respectively.
22