Saks Fifth Avenue 2011 Annual Report Download - page 23
Download and view the complete annual report
Please find page 23 of the 2011 Saks Fifth Avenue annual report below. You can navigate through the pages in the report by either clicking on the pages listed below, or by using the keyword search tool below to find specific information within the annual report.-
 1
1 -
2
-
3
-
4
-
5
-
6
-
7
-
8
-
9
-
10
-
11
-
12
-
 13
13 -
 14
14 -
 15
15 -
 16
16 -
 17
17 -
 18
18 -
 19
19 -
 20
20 -
 21
21 -
 22
22 -
 23
23 -
 24
24 -
 25
25 -
 26
26 -
 27
27 -
 28
28 -
 29
29 -
 30
30 -
 31
31 -
 32
32 -
 33
33 -
34
-
35
-
36
-
37
-
38
-
39
-
40
-
41
-
42
-
43
-
44
-
45
-
46
-
47
-
48
-
49
-
50
-
51
-
52
-
53
-
54
-
55
-
56
-
57
-
58
-
59
-
60
-
61
-
62
-
63
-
64
-
65
-
66
-
67
-
68
-
69
-
70
-
71
-
72
-
73
-
74
-
75
-
76
-
77
-
78
-
79
-
80
-
81
-
82
-
83
-
84
-
85
-
86
-
87
-
88
-
89
-
90
-
91
 |
 |

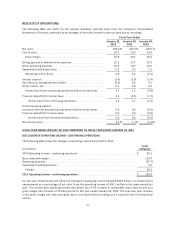
RESULTS OF OPERATIONS
The following table sets forth, for the periods indicated, selected items from the Company’s Consolidated
Statements of Income, expressed as percentages of net sales (numbers may not total due to rounding):
Fiscal Year Ended
January 28,
2012
January 29,
2011
January 30,
2010
Net sales ................................................. 100.0 % 100.0 % 100.0 %
Cost of sales .............................................. 59.2 59.9 63.4
Gross margin ............................................ 40.8 40.1 36.6
Selling, general & administrative expenses ...................... 25.5 25.7 25.6
Other operating expenses ................................... 10.0 10.7 12.0
Impairments and dispositions ................................ 0.3 0.5 1.1
Operating income (loss) ................................... 4.9 3.2 (2.1)
Interest expense ........................................... (1.6) (2.0) (1.9)
Gain (loss) on extinguishment of debt .......................... (0.0) 0.0 0.0
Other income, net .......................................... 0.1 0.0 0.0
Income (loss) from continuing operations before income taxes .... 3.4 1.2 (3.9)
Provision (benefit) for income taxes ........................... 0.9 (0.5) (1.7)
Income (loss) from continuing operations ................... 2.5 1.7 (2.2)
Discontinued operations:
Income (loss) from discontinued operations before income taxes .... 0.0 0.0 (0.0)
Provision (benefit) for income taxes ........................... 0.0 0.0 (0.0)
Income (loss) from discontinued operations ................. 0.0 0.0 (0.0)
Net income (loss) .......................................... 2.5% 1.7% (2.2)%
FISCAL YEAR ENDED JANUARY 28, 2012 COMPARED TO FISCAL YEAR ENDED JANUARY 29, 2011
DISCUSSION OF OPERATING INCOME– CONTINUING OPERATIONS
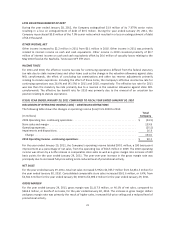
The following table shows the changes in operating income from 2010 to 2011:
(In millions)
Total
Company
2010 Operating income - continuing operations ....................................... $ 90.1
Store sales and margin ........................................................... 110.9
Operating expenses .............................................................. (55.7)
Impairments and dispositions ...................................................... 3.0
Change ...................................................................... 58.2
2011 Operating income - continuing operations ....................................... $ 148.3
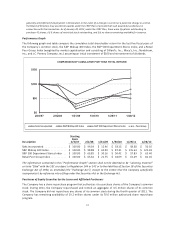
For the year ended January 28, 2012, the Company’s operating income totaled $148.3 million, a 170 basis point
improvement as a percentage of net sales, from the operating income of $90.1 million in the same period last
year. The current year operating income was driven by a 9.5% increase in comparable store sales as well as a
gross margin rate increase of 70 basis points for the year ended January 28, 2012. The year-over-year increase
in the gross margin rate was principally due to increased full-price selling and a reduced level of promotional
activity.
21