Saks Fifth Avenue 2011 Annual Report Download - page 25
Download and view the complete annual report
Please find page 25 of the 2011 Saks Fifth Avenue annual report below. You can navigate through the pages in the report by either clicking on the pages listed below, or by using the keyword search tool below to find specific information within the annual report.-
 1
1 -
2
-
3
-
4
-
5
-
6
-
7
-
8
-
9
-
10
-
11
-
12
-
13
-
14
-
 15
15 -
 16
16 -
 17
17 -
 18
18 -
 19
19 -
 20
20 -
 21
21 -
 22
22 -
 23
23 -
 24
24 -
 25
25 -
 26
26 -
 27
27 -
 28
28 -
 29
29 -
 30
30 -
 31
31 -
 32
32 -
 33
33 -
 34
34 -
 35
35 -
36
-
37
-
38
-
39
-
40
-
41
-
42
-
43
-
44
-
45
-
46
-
47
-
48
-
49
-
50
-
51
-
52
-
53
-
54
-
55
-
56
-
57
-
58
-
59
-
60
-
61
-
62
-
63
-
64
-
65
-
66
-
67
-
68
-
69
-
70
-
71
-
72
-
73
-
74
-
75
-
76
-
77
-
78
-
79
-
80
-
81
-
82
-
83
-
84
-
85
-
86
-
87
-
88
-
89
-
90
-
91
 |
 |

LOSS ON EXTINGUISHMENT OF DEBT
During the year ended January 28, 2012, the Company extinguished $1.9 million of its 7.375% senior notes
resulting in a loss on extinguishment of debt of $0.5 million. During the year ended January 29, 2011, the
Company repurchased $0.8 million of the 7.0% senior notes which resulted in a loss on extinguishment of debt
of $4.0 thousand.
OTHER INCOME, NET
Other income increased to $2.2 million in 2011 from $0.1 million in 2010. Other income in 2011 was primarily
related to interest income on cash and cash equivalents. Other income in 2010 consisted primarily of $0.7
million of interest income on cash and cash equivalents offset by $0.6 million of casualty losses relating to the
May 2010 flood at the Nashville, Tennessee OFF 5TH store.
INCOME TAXES
For 2011 and 2010, the effective income tax rate for continuing operations differed from the federal statutory
tax rate due to state income taxes and other items such as the change in the valuation allowance against state
NOL carryforwards, the effect of concluding tax examinations and other tax reserve adjustments primarily
relating to statute expirations. Including the effect of these items, the Company’s effective income tax rate for
continuing operations was 26.6% and (41.5%) in 2011 and 2010, respectively. The effective tax rate for 2011
was less than the statutory tax rate primarily due to a reversal in the valuation allowance against state NOL
carryforwards. The effective tax benefit rate for 2010 was primarily due to the reversal of an uncertain tax
position relating to statute expirations.
FISCAL YEAR ENDED JANUARY 29, 2011 COMPARED TO FISCAL YEAR ENDED JANUARY 30, 2010
DISCUSSION OF OPERATING INCOME (LOSS) – CONTINUING OPERATIONS
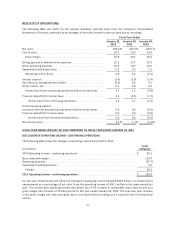
The following table shows the changes in operating income (loss) from 2009 to 2010:
(In millions)
Total
Company
2009 Operating loss- continuing operations ............................................ $ (54.5)
Store sales and margin ............................................................ 153.8
Operating expenses ............................................................... (25.5)
Impairments and dispositions ....................................................... 16.3
Change ....................................................................... 144.6
2010 Operating income - continuing operations ........................................ $ 90.1
For the year ended January 29, 2011, the Company’s operating income totaled $90.1 million, a 530 basis point
improvement as a percentage of net sales, from the operating loss of $54.5 million in 2009. The 2010 operating
income was driven by a 6.4% increase in comparable store sales as well as a gross margin rate increase of 350
basis points for the year ended January 29, 2011. The year-over-year increase in the gross margin rate was
principally due to increased full-price selling and a reduced level of promotional activity.
NET SALES
For the year ended January 29, 2011, total net sales increased 5.9% to $2,785.7 million from $2,631.5 million for
the year ended January 30, 2010. Consolidated comparable store sales increased $161.6 million, or 6.4%, from
$2,531.6 million for the year ended January 30, 2010 to $2,693.2 million for the year ended January 29, 2011.
GROSS MARGIN
For the year ended January 29, 2011, gross margin was $1,117.3 million, or 40.1% of net sales, compared to
$963.4 million, or 36.6% of net sales, for the year ended January 30, 2010. The increase in gross margin dollars
and gross margin rate was primarily the result of higher sales, increased full-price selling and a reduced level of
promotional activity.
23