Saks Fifth Avenue 2011 Annual Report Download - page 72
Download and view the complete annual report
Please find page 72 of the 2011 Saks Fifth Avenue annual report below. You can navigate through the pages in the report by either clicking on the pages listed below, or by using the keyword search tool below to find specific information within the annual report.-
 1
1 -
2
-
3
-
4
-
5
-
6
-
7
-
8
-
9
-
10
-
11
-
12
-
13
-
14
-
15
-
16
-
17
-
18
-
19
-
20
-
21
-
22
-
23
-
24
-
25
-
26
-
27
-
28
-
29
-
30
-
31
-
32
-
33
-
34
-
35
-
36
-
37
-
38
-
39
-
40
-
41
-
42
-
43
-
44
-
45
-
46
-
47
-
48
-
49
-
50
-
51
-
52
-
53
-
54
-
55
-
56
-
57
-
58
-
59
-
60
-
61
-
 62
62 -
 63
63 -
 64
64 -
 65
65 -
 66
66 -
 67
67 -
 68
68 -
 69
69 -
 70
70 -
 71
71 -
 72
72 -
 73
73 -
 74
74 -
 75
75 -
 76
76 -
 77
77 -
 78
78 -
 79
79 -
 80
80 -
 81
81 -
 82
82 -
83
-
84
-
85
-
86
-
87
-
88
-
89
-
90
-
91
 |
 |

SAKS INCORPORATED & SUBSIDIARIES
NOTES TO CONSOLIDATED FINANCIAL STATEMENTS
(In thousands, except per share amounts)
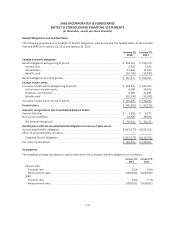
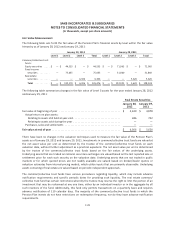
The weighted-average assumptions used to determine the net periodic benefit cost are as follows:
2011 2010 2009
Pension Plan:
Discount rate ...................................................... 4.8% 5.1% 6.5%
Expected long-term rate of return on plan assets .......................... 7.5% 8.0% 8.0%
Rate of compensation increase ........................................ n/a n/a 4.0%
SERP:
Discount rate ...................................................... 5.1% 5.5% 6.6%
The assumptions used in the determination of the Company’s obligations and benefit cost are based upon
management’s best estimates as of the annual measurement date. The discount rate is primarily used in
calculating the Company’s pension obligation, which is represented by the accumulated benefit obligation
(“ABO”) and the projected benefit obligation (“PBO”) and in calculating net periodic benefit cost. The discount
rate utilized was based upon pension discount curves and bond portfolio curves over a duration that is similar
to the Pension Plan’s expected future cash flows as of the measurement date.
This expected long-term rate of return on plan assets is used primarily in calculating the expected return on
plan assets component of the Company’s net periodic benefit cost. The Company’s estimate of the expected
long-term rate of return considers the historical returns on plan assets, as well as the future expectations of
returns on classes of assets within the target asset allocation of the plan asset portfolio. The expected long-term
rate of return on plan assets is the weighted-average rate of earnings expected on the funds invested or to be
invested to provide for the benefits included in the PBO.
The assumed average rate of compensation increase is the average annual compensation increase expected
over the remaining employment periods for the participating employees and is primarily used in calculating the
PBO and net periodic benefit cost. No assumption was used in 2010 or 2011 as the Pension Plan was amended
to suspend all future benefit accruals for all participants.
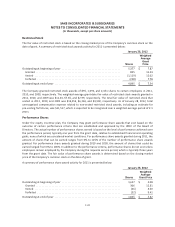
Plan Assets
The Company’s investment strategy is to maintain a diversified portfolio of assets with the primary goal of
ensuring that funds are available to meet the Pension Plan’s benefit obligations when they become due, while
maintaining an appropriate level of risk. The Pension Plan’s target asset allocation is determined by the
Company’s Retirement Committee, taking into consideration the amounts and timing of projected liabilities, the
Company’s funding policies, expected returns on various asset categories, as well as the risk characteristics of,
and correlations among, the various asset classes. The Pension Plan does not hold any investments in the
Company’s common stock. Actual asset allocations as of January 28, 2012 and January 29, 2011 and the
targeted asset allocation as of January 28, 2012 by asset category are as follows:
Target
Allocation
January 28,
2012
January 29,
2011
Common/collective trust funds:
Equity securities ............................................. 35.0% 35.2% 55.3%
Fixed income securities ....................................... 60.0% 59.8% 40.3%
Real estate securities ......................................... 5.0% 5.0% 4.4%
Total .................................................... 100.0% 100.0% 100.0%
F-27