Saks Fifth Avenue 2011 Annual Report Download - page 19
Download and view the complete annual report
Please find page 19 of the 2011 Saks Fifth Avenue annual report below. You can navigate through the pages in the report by either clicking on the pages listed below, or by using the keyword search tool below to find specific information within the annual report.-
 1
1 -
2
-
3
-
4
-
5
-
6
-
7
-
8
-
 9
9 -
 10
10 -
 11
11 -
 12
12 -
 13
13 -
 14
14 -
 15
15 -
 16
16 -
 17
17 -
 18
18 -
 19
19 -
 20
20 -
 21
21 -
 22
22 -
 23
23 -
 24
24 -
 25
25 -
 26
26 -
 27
27 -
 28
28 -
 29
29 -
30
-
31
-
32
-
33
-
34
-
35
-
36
-
37
-
38
-
39
-
40
-
41
-
42
-
43
-
44
-
45
-
46
-
47
-
48
-
49
-
50
-
51
-
52
-
53
-
54
-
55
-
56
-
57
-
58
-
59
-
60
-
61
-
62
-
63
-
64
-
65
-
66
-
67
-
68
-
69
-
70
-
71
-
72
-
73
-
74
-
75
-
76
-
77
-
78
-
79
-
80
-
81
-
82
-
83
-
84
-
85
-
86
-
87
-
88
-
89
-
90
-
91
 |
 |
generally are forfeited if employment is terminated. In the event of a change in control or a potential change in control,
the Board of Directors may accelerate awards under the 1997 Plan or provide that such awards be cashed out in
connection with the transaction. As of January 28, 2012, under the 1997 Plan, there were (i) options outstanding to
purchase 41 shares, (ii) 8 shares of restricted stock outstanding, and (iii) no shares remaining available for issuance.
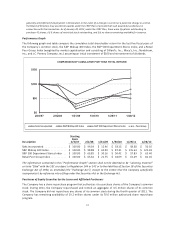
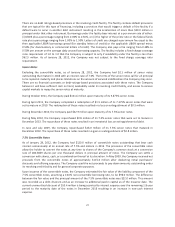
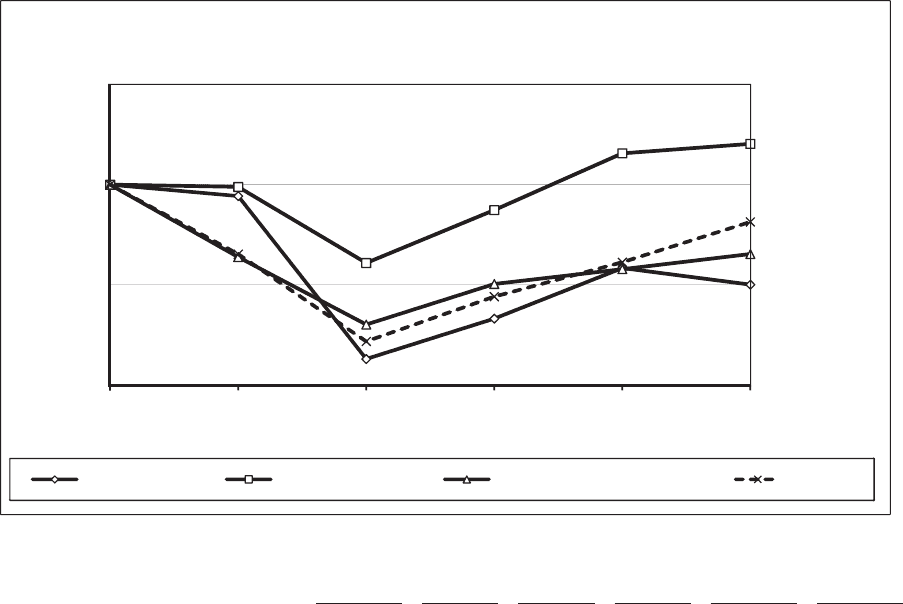
Performance Graph
The following graph and table compare the cumulative total shareholder return for the last five fiscal years of
the Company’s common stock, the S&P Midcap 400 Index, the S&P 500 Department Stores Index, and a Retail
Peer Group Index (weighted by market capitalization and consisting of Dillard’s, Inc.; Macy’s, Inc.; Nordstrom,
Inc.; and J.C. Penney Company, Inc.) assuming an initial investment of $100 and reinvestment of dividends.
$0
$50
$100
$150
2/03/07 2/02/08 1/31/09 1/30/10 1/29/11 1/28/12
COMPARISON OF CUMULATIVE FIVE YEAR TOTAL RETURN
Saks Incorporated S&P MidCap 400 Index S&P 500 Department Stores Index Peer Group
Description
Starting
Basis
2/3/07 2/2/08 1/31/09 1/30/10 1/29/11 1/28/12
Saks Incorporated ............... $ 100.00 $ 94.34 $ 12.96 $ 33.13 $ 58.38 $ 50.10
S&P Midcap 400 Index ............ $ 100.00 $ 98.88 $ 60.90 $ 87.31 $ 115.64 $ 120.39
S&P 500 Department Stores Index . . $ 100.00 $ 63.85 $ 30.16 $ 50.42 $ 57.83 $ 65.40
Retail Peer Group Index ........... $ 100.00 $ 65.32 $ 21.75 $ 44.09 $ 61.29 $ 81.45
The information contained in this “Performance Graph” section shall not be deemed to be “soliciting material”
or to be “filed” with the SEC or subject to Regulation 14A or 14C or to the liabilities of Section 18 of the Securities
Exchange Act of 1934, as amended (the “Exchange Act”), except to the extent that the Company specifically
incorporates it by reference into a filing under the Securities Act or the Exchange Act.
Purchases of Equity Securities by the Issuer and Affiliated Purchasers
The Company has a share repurchase program that authorizes it to purchase shares of the Company’s common
stock. During 2011, the Company repurchased and retired an aggregate of 3.5 million shares of its common
stock. The Company did not repurchase any shares of its common stock during the fourth quarter of 2011. The
Company has remaining availability of 29.2 million shares under its 70.0 million authorized share repurchase
program.
17