Redbox 2014 Annual Report Download - page 98
Download and view the complete annual report
Please find page 98 of the 2014 Redbox annual report below. You can navigate through the pages in the report by either clicking on the pages listed below, or by using the keyword search tool below to find specific information within the annual report.-
 1
1 -
2
-
3
-
4
-
5
-
6
-
7
-
8
-
9
-
10
-
11
-
12
-
13
-
14
-
15
-
16
-
17
-
18
-
19
-
20
-
21
-
22
-
23
-
24
-
25
-
26
-
27
-
28
-
29
-
30
-
31
-
32
-
33
-
34
-
35
-
36
-
37
-
38
-
39
-
40
-
41
-
42
-
43
-
44
-
45
-
46
-
47
-
48
-
49
-
50
-
51
-
52
-
53
-
54
-
55
-
56
-
57
-
58
-
59
-
60
-
61
-
62
-
63
-
64
-
65
-
66
-
67
-
68
-
69
-
70
-
71
-
72
-
73
-
74
-
75
-
76
-
77
-
78
-
79
-
80
-
81
-
82
-
83
-
84
-
85
-
86
-
87
-
 88
88 -
 89
89 -
 90
90 -
 91
91 -
 92
92 -
 93
93 -
 94
94 -
 95
95 -
 96
96 -
 97
97 -
 98
98 -
 99
99 -
 100
100 -
 101
101 -
 102
102 -
 103
103 -
 104
104 -
 105
105 -
 106
106 -
 107
107 -
 108
108 -
109
-
110
-
111
-
112
-
113
-
114
-
115
-
116
-
117
-
118
-
119
-
120
-
121
-
122
-
123
-
124
-
125
-
126
 |
 |

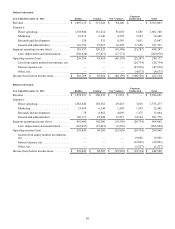
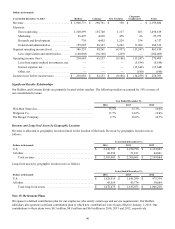
90
Dollars in thousands
Year Ended December 31, 2012 Redbox Coinstar New Ventures
Corporate
Unallocated Total
Revenue . . . . . . . . . . . . . . . . . . . . . . . . . . . . . . . $ 1,908,773 $ 290,761 $ 350 $ — $ 2,199,884
Expenses:
Direct operating . . . . . . . . . . . . . . . . . . . . . 1,340,899 155,740 1,317 863 1,498,819
Marketing . . . . . . . . . . . . . . . . . . . . . . . . . . 20,497 4,938 478 66 25,979
Research and development . . . . . . . . . . . . . 739 4,455 1,229 334 6,757
General and administrative . . . . . . . . . . . . . 159,885 26,367 6,283 11,984 204,519
Segment operating income (loss). . . . . . . . . . . . 386,753 99,261 (8,957)(13,247) 463,810
Less: depreciation and amortization . . . . . . (148,068) (36,108)(229)—
(184,405)
Operating income (loss). . . . . . . . . . . . . . . . . . . 238,685 63,153 (9,186)(13,247) 279,405
Loss from equity method investments, net .———
(5,184)(5,184)
Interest expense, net . . . . . . . . . . . . . . . . . . ———
(15,648)(15,648)
Other, net . . . . . . . . . . . . . . . . . . . . . . . . . . ———
(180)(180)
Income (loss) before income taxes . . . . . . . . . . $ 238,685 $ 63,153 $ (9,186)$ (34,259) $ 258,393
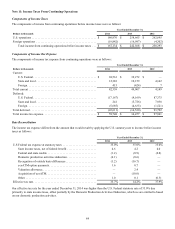
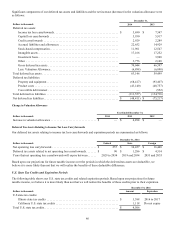
Significant Retailer Relationships
Our Redbox and Coinstar kiosks are primarily located within retailers. The following retailers accounted for 10% or more of
our consolidated revenue:
Year Ended December 31,
2014 2013 2012
Wal-Mart Stores Inc.. . . . . . . . . . . . . . . . . . . . . . . . . . . . . . . . . . . . . . 15.5% 15.3% 16.0%
Walgreen Co.. . . . . . . . . . . . . . . . . . . . . . . . . . . . . . . . . . . . . . . . . . . . 13.7% 14.6% 16.0%
The Kroger Company . . . . . . . . . . . . . . . . . . . . . . . . . . . . . . . . . . . . . 9.7% 10.0% 10.7%
Revenue and Long-lived Assets by Geographic Location
Revenue is allocated to geographic locations based on the location of the kiosk. Revenue by geographic location was as
follows:
Years Ended December 31,
Dollars in thousands 2014 2013 2012
U.S. . . . . . . . . . . . . . . . . . . . . . . . . . . . . . . . . . . . . . . . . . . . . . . . . . . . $ 2,242,753 $ 2,254,790 $ 2,154,943
All other . . . . . . . . . . . . . . . . . . . . . . . . . . . . . . . . . . . . . . . . . . . . . . . 60,250 51,811 44,941
Total revenue . . . . . . . . . . . . . . . . . . . . . . . . . . . . . . . . . . . . . . . . $ 2,303,003 $ 2,306,601 $ 2,199,884
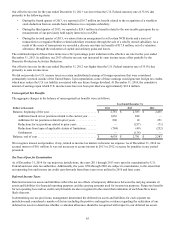
Long-lived assets by geographic location were as follows:
Years Ended December 31,
Dollars in thousands 2014 2013 2012
U.S. . . . . . . . . . . . . . . . . . . . . . . . . . . . . . . . . . . . . . . . . . . . . . . . . . . . $ 1,028,516 $ 1,141,299 $ 975,334
All other . . . . . . . . . . . . . . . . . . . . . . . . . . . . . . . . . . . . . . . . . . . . . . . 43,559 43,774 30,884
Total long-lived assets . . . . . . . . . . . . . . . . . . . . . . . . . . . . . . . . . $ 1,072,075 $ 1,185,073 $ 1,006,218
Note 15: Retirement Plans
We sponsor a defined contribution plan for our employees who satisfy certain age and service requirements. Our Redbox
subsidiary also sponsors a defined contribution plan to which new contributions were frozen effective January 1, 2010. Our
contributions to these plans were $4.3 million, $4.9 million and $4.0 million in 2014, 2013 and 2012, respectively.